
Integrating telemetry into Java applications with Open Telemetry Collector
Today, I’m going to show how to use the Open Telemetry Java Agent to collect logs, traces and metrics from your Java applications, send them to the Open Telemetry Collector, and display the data in multiple backends. We’ll use a single docker-compose file to spin up all the required services. The final architecture that we’ll build will be as follows:

Sample Application
For the tests, we’re going to use a sample application consisting of 3 micro services that simply call each other in the same order, with a delay between the API calls to make the traces longer:

Each application is going to emit logs around each REST API called. Our goal is to see the call stack in a unified view, and to be able to tie the logs under the same trace.
Java Agent
The Java Agent is a zero-code instrumentation method which attaches an agent to the JVM to capture telemetry from many popular libraries and frameworks. It works by intercepting specific methods from many popular libraries and frameworks and dynamically injecting bytecode around them. This allows for the capture of data at the “edges” of the application, such as inbound requests, outbound HTTP calls, database calls and others, without modifying the source code directly. For example, to capture temeletry data from database calls in an application using JDBC, the java.sql.Statement.execute() method can be intercepted.
You can find the latest release of the agent in the official Getting Started page. A clean way to run the agent with the application is to define the JAVA_TOOL_OPTIONS and OTEL_SERVICE_NAME environment variables.
export JAVA_TOOL_OPTIONS="-javaagent:path/to/opentelemetry-javaagent.jar"
export OTEL_SERVICE_NAME="your-service-name"
java -jar myapp.jar
Containerizing the application
Since we’re going to run all the services in a single docker compose file, we have to define the Dockerfile to generate the image for each of the 3 applications. The Dockerfile is very simple, we’ll only copy the built .jar to the container and also the java agent. Place the javaagent.jar on the root of the folder, at the same level of the “src” folder and the Dockerfile.
FROM eclipse-temurin:21-jdk-alpine

WORKDIR /serviceA

COPY target/serviceA-0.0.1-SNAPSHOT.jar serviceA.jar

# Copy OpenTelemetry agent
COPY opentelemetry-javaagent.jar opentelemetry-javaagent.jar

EXPOSE 8080

ENTRYPOINT ["java", "-jar", "serviceA.jar"]
Note: since we’re not using Maven image inside the Dockerfile to generate the compiled .jar, we must run the “mvn install” command after every change made to the application, to regenerate the compiled jar which will be copied to the container. If you make changes to one of the applications and forgot to run the command, you’ll get the incorrect impression that the changes had no effect.
Open Telemetry Collector
The OTel Collector is a service designed specifically to sit between the monitored applications and observability backends. It acts as a centralized pipeline to receive, process, and export telemetry data to multiple backend services. It also serves as a traffic controller, allowing to customize the sampling rate, tail sampling, rate limiting/throttling, aggregating metrics, and others.
To use the collector, the applications have to define a few important environment variables:
- OTEL_SERVICE_NAME: defines the service name.
- OTEL_EXPORTER_OTLP_PROTOCOL: defines the protocol for export data. Usually is grpc or http.
- OTEL_EXPORTER_OTLP_ENDPOINT: the endpoint to send the data to. It’s the collector’s endpoint, but if you’re not using a collector, this is set to the backend endpoint directly. When not using a collector, it’s only possible to send data to one backend.
- OTEL_TRACES_EXPORTER: defines which exporter to use for traces.
- OTEL_LOGS_EXPORTER: defines which exporter to use for logs.
- OTEL_METRICS_EXPORTER: defines which exporter to use for metrics.
All the OTEL_XYZ_EXPORTER variables can be set to “none”, which doesn’t export anything, “logging” to print data to stdout (useful for local debbuging), “otlp” to export using the OTLP protocol (which is the most common), or the name of a specific backend service such as “zipkin”.
Furthermore, the OTEL collector pipeline is entirely configured using a yaml file, which defines all the receivers, processors and exporters. We’re going to use this configuration file for the examples:
receivers:
  otlp:
    protocols:
      grpc:
        endpoint: 0.0.0.0:4317
      http:

exporters:
  otlp/jaeger:
    endpoint: jaeger:4317
    tls:
      insecure: true

  otlp/tempo:
    endpoint: tempo:4317
    tls:
      insecure: true

  otlphttp:
    endpoint: http://loki:3100/otlp

  otlp/elastic:
    endpoint: apm-server:8200
    tls:
      insecure: true

  zipkin:
    endpoint: http://zipkin:9411/api/v2/spans
    tls:
      insecure: true

processors:
  batch:

service:
  pipelines:
    traces:
      receivers: [otlp]
      processors: [batch]
      exporters: [otlp/jaeger, otlp/tempo, otlp/elastic, zipkin]

    logs:
      receivers: [otlp]
      processors: [batch]
      exporters: [otlphttp, otlp/elastic]
The receiver is the gRPC endpoint (0.0.0.0:4317), and the exporters will be our backend observability services. Some of them accepts OTLP natively, such as Jaeger, Grafana’s Tempo, and Elastic’s APM Server, some of them use OTLP over HTTP such as Grafana’s Loki, and some of them have specific keywords like Zipkin.
In the example above, we’re sending traces to Jaeger, Tempo, Elastic Server and Zipkin, and sending logs do Loki and Elastic Server. We’re not sending metrics to any service.
Note: the name of the exporter is made of the protocol and an optional alias, useful for naming different backends that use the same protocol. So, for instance, “otlp/jaeger” is actually just OTLP. But since Tempo also uses OTLP, they can’t both be named “otlp” at the same time, so we give an alias. Furthermore, the Loki exporter uses “otlphttp”, and since nothing else in the pipeline uses this configuration, I don’t need an alias, but it could’ve been named “otlphttp/loki”.
Although we won’t use it in this tutorial, we can configure the pipeline to process the data in a more intelligent way, creating policies on when to ingest traces based on status codes and latency, as well as probabilistic sampling for high traffic environments which doesn’t need to capture 100% of the traces.
processors:
  tail_sampling:
    decision_wait: 10s
    num_traces: 50000
    policies:
      - name: errors-policy
        type: status_code
        status_code:
          status_codes: [ERROR]

      - name: slow-policy
        type: latency
        latency:
          threshold_ms: 2000

      - name: probabilistic-policy
        type: probabilistic
        probabilistic:
          sampling_percentage: 5
Docker Compose
Finally, the docker-compose.yml will spin up all the application services, the Open Telemetry Collector and the backend services. Some backends might require specific configuration files, which are provided in the GitHub repository of this project.
services:
  service-a:
    build: ./serviceA
    container_name: service-a
    restart: always
    environment:
      - OTEL_SERVICE_NAME=serviceA
      - OTEL_TRACES_EXPORTER=otlp
      - OTEL_LOGS_EXPORTER=otlp
      - OTEL_METRICS_EXPORTER=otlp
      - OTEL_EXPORTER_OTLP_PROTOCOL=grpc
      - OTEL_EXPORTER_OTLP_ENDPOINT=http://otel-collector:4317
      - JAVA_TOOL_OPTIONS=-javaagent:/serviceA/opentelemetry-javaagent.jar
    ports:
      - "8080:8080"
    depends_on:
      - service-b

  service-b:
    build: ./serviceB
    container_name: service-b
    restart: always
    environment:
      - OTEL_SERVICE_NAME=serviceB
      - OTEL_TRACES_EXPORTER=otlp
      - OTEL_LOGS_EXPORTER=otlp
      - OTEL_METRICS_EXPORTER=otlp
      - OTEL_EXPORTER_OTLP_PROTOCOL=grpc
      - OTEL_EXPORTER_OTLP_ENDPOINT=http://otel-collector:4317
      - JAVA_TOOL_OPTIONS=-javaagent:/serviceB/opentelemetry-javaagent.jar
    ports:
      - "8081:8080"
    depends_on:
      - service-c

  service-c:
    build: ./serviceC
    container_name: service-c
    restart: always
    environment:
      - OTEL_SERVICE_NAME=serviceC
      - OTEL_TRACES_EXPORTER=otlp
      - OTEL_LOGS_EXPORTER=otlp
      - OTEL_METRICS_EXPORTER=otlp
      - OTEL_EXPORTER_OTLP_PROTOCOL=grpc
      - OTEL_EXPORTER_OTLP_ENDPOINT=http://otel-collector:4317
      - JAVA_TOOL_OPTIONS=-javaagent:/serviceC/opentelemetry-javaagent.jar
    ports:
      - "8082:8080"

  otel-collector:
      image: otel/opentelemetry-collector-contrib:latest
      container_name: otel-collector
      command: [ "--config=/etc/otel-collector.yaml" ]
      volumes:
        - ./otel/otel-collector.yaml:/etc/otel-collector.yaml
      ports:
        - "4317:4317"

  elasticsearch:
    image: elasticsearch:8.17.1
    container_name: elasticsearch
    restart: always
    volumes:
      - elastic_data:/usr/share/elasticsearch/data/
    environment:
      - xpack.security.enabled=false  #Disable security for local development
      - ES_JAVA_OPTS=-Xmx256m -Xms256m
      - discovery.type=single-node
    ports:
      - '9200:9200'

  apm-server:
    image: docker.elastic.co/apm/apm-server:8.17.1
    container_name: apm-server
    depends_on:
      - elasticsearch
    ports:
      - "8200:8200"   # APM intake (HTTP)
    environment:
      APM_SERVER_HOST: "0.0.0.0:8200"
      APM_SERVER_OTLP_ENABLED: "true"
      APM_SERVER_OTLP_GRPC_ENABLED: "true"
      APM_SERVER_OTLP_HTTP_ENABLED: "true"
      OUTPUT_ELASTICSEARCH_HOSTS: '["http://elasticsearch:9200"]'
      XPACK_SECURITY_ENABLED: "false"

  kibana:
    image: kibana:8.17.1
    container_name: kibana
    restart: always
    ports:
      - '5601:5601'
    environment:
      - ELASTICSEARCH_URL=http://elasticsearch:9200
    depends_on:
      - elasticsearch

  jaeger:
    image: jaegertracing/all-in-one:latest
    container_name: jaeger
    ports:
      - "16686:16686" # Web UI

  zipkin:
      image: openzipkin/zipkin:latest
      container_name: zipkin
      ports:
        - "9411:9411" # Web UI

  grafana:
    image: grafana/grafana:latest
    container_name: grafana
    ports:
      - "3000:3000" # Web UI

  tempo:
    image: grafana/tempo:latest
    container_name: tempo
    command: [ "-config.file=/etc/tempo.yaml" ]
    volumes:
      - ./grafana/tempo.yaml:/etc/tempo.yaml

  loki:
    image: grafana/loki:latest
    container_name: loki
    command: -config.file=/etc/loki/local-config.yaml
    ports:
      - "3100:3100"
    volumes:
      - ./grafana/loki.yaml:/etc/loki/local-config.yaml
First, we have the 3 application services, all of them need to define the same environment variables. Then, we have the otel-collector service, and then we have all the backend services. Finally, we just have to run the command below to start all the services:
docker compose up -d
Note that we don’t need to map the ports used by every service to the host. Jaeger receives data at port 4317, but since the host won’t need to access it, we can map only the UI port, 16686:16686. Port 4317 will still be visible to the other services internally.
Testing the Observability Backends
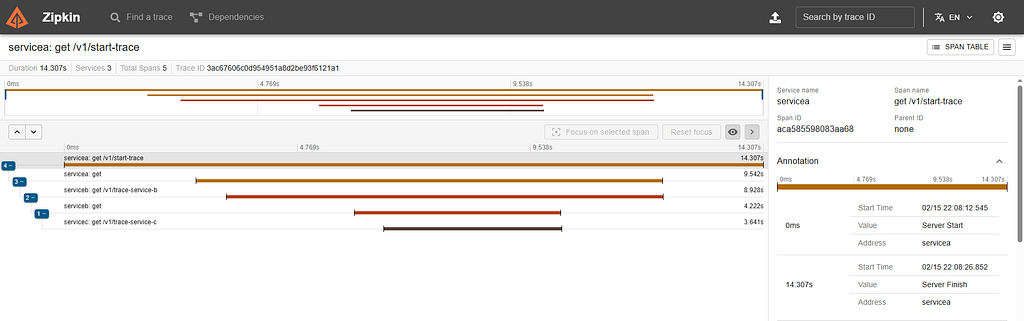
Jaeger and Zipkin both have their own UIs, which receives only Traces and doesn’t require configuration files. After making a GET request to http://localhost:8080/v1/start-trace and accessing Jaeger UI on http://localhost:16686, we can find the generated trace:

The URL shows the trace_id, which is 3ac67606c0d954951a8d2be93f6121a1. This trace_id was generated by the java agent, and thus, will be the same trace_id regardless of the backend utilized. We can see the same trace in Zipkin, accessing http://localhost:9411:
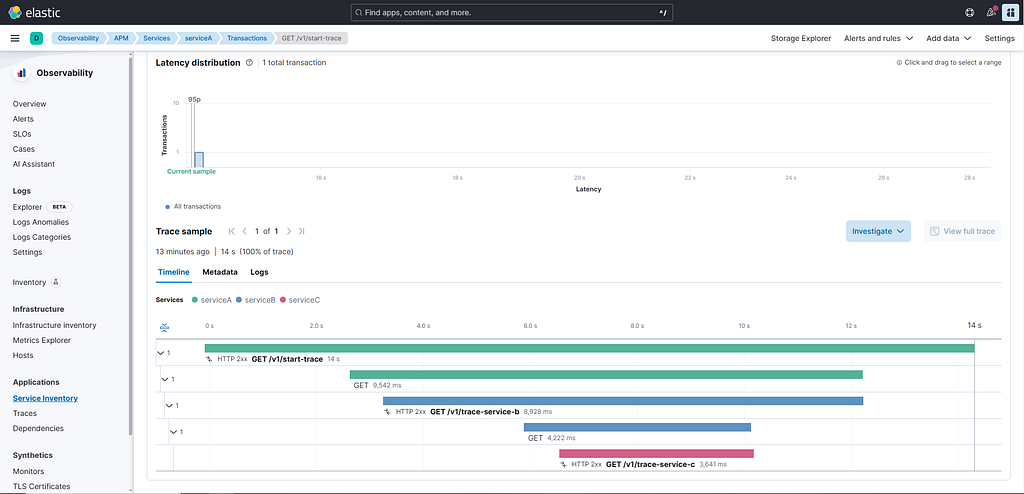
Our next backend, APM-Server, is a little bit more complicated to set up, because the APM-Server itself doesn’t store the data, and doesn’t have a dedicated UI. Instead, the APM-Server receives the data and forwards it to the ElasticSearch service, which stores the data and serves as the database. Then, Kibana provides a UI which queries the ElasticSearch to get the data.
Acessing http://localhost:5601, we can find the Kibana UI. Then, we have to open the sidebar and navigate to Observability → APM → Traces to find the traces, then we can click on the trace_id to see the following:
Since logs are also sent to the APM Server, we can go to Analytics → Discover to find the logs. The UI provides lot’s of fields to filter and display on the table. I choose to display the fields “message”, “trace_id” and “service.name”, and filter out some initialization messages. We can see the 6 logs emmited during the request to serviceA:

Finally, our last backend is Grafana integrated with Tempo (traces) and Loki (logs). This requires configuration files for both Tempo and Loki. Grafana also requires a few manual steps to configure it to integrate with the other services. This can be done using a configuration file as well, but I did it manually for test purposes.
After accessing http://localhost:3000 for Grafana UI, and logging in with the default user/password (admin/admin), we need to configure 2 data sources.

Both of these data sources are fairly simple to get working with minimal configuration, basically we just have to inform the URL of each service and keep the rest of the options default:


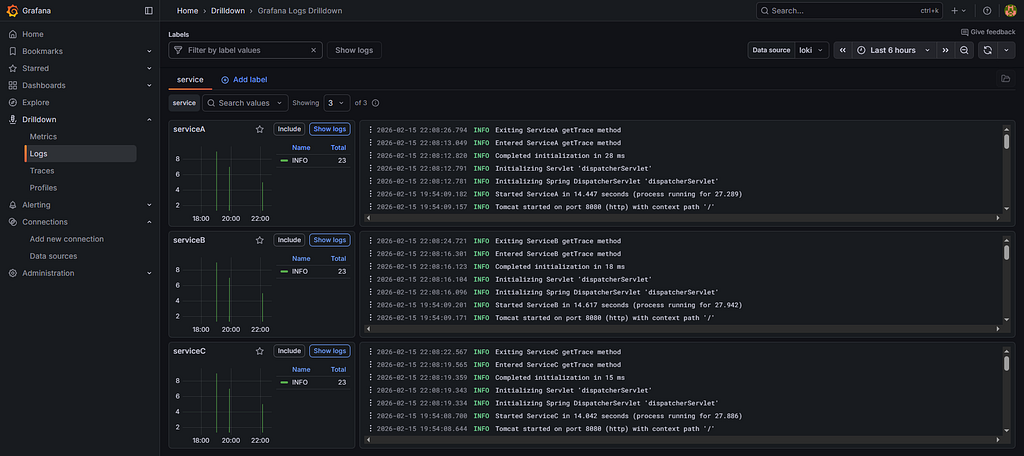
Now, under Drilldown → Traces, we can search the traces and find our trace once again to see the details. Under Drilldown → Logs, we can find the logs separated per service.

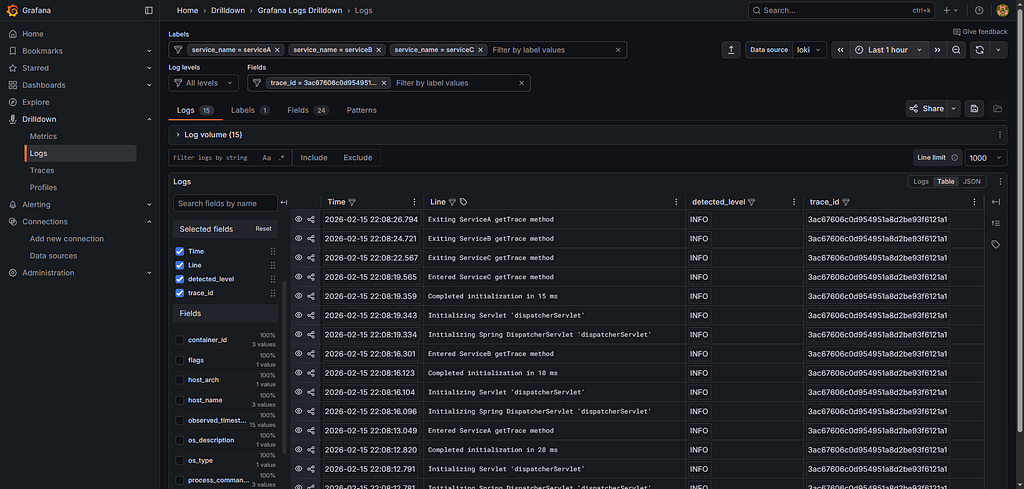
After clicking in one of the logs, it’s possible to add more filters, allowing to search for the logs with the same trace_id:
Conclusion
We can see how powerful the Open Telemetry ecosystem is, as we can have many backends connected to the same pipeline, and also be vendor neutral because they all share the same OTLP protocol, and the application emitting the telemetry data doesn’t need to know which backend is being used.
In addition to the Java Agent solution, it’s also possible enhance the spans with code instrumentation through the use of Annotations or directly interacting with the SDK. Here you can find more about the instrumentation ecosystem.
Also, we can configure the pipeline to process the data in the best way to suit the application needs, allowing the creation of policies on how to ingest traces based on specific conditions.
Furthermore, the project is Open Source and constantly developing. If you’re interested on how the instrumentation works under the hood, the source code for the agents and library instrumentation is available here.
![]()
Integrating telemetry into Java applications with Open Telemetry Collector was originally published in Javarevisited on Medium, where people are continuing the conversation by highlighting and responding to this story.
This post first appeared on Read More