
Integrating UX into capacity planning
How to balance Total Project Demand with Team Capacity to take control of your workload, avoid burn out, & set your team up for success.
One of the problems I have seen UX teams and entire UX practices struggle with again and again is getting their capacity accounted for when creating roadmaps or committing to work.
Often, UX is an afterthought or informed by how much time they have for deadlines. Usually, it’s calculated by looking at when engineering needs to start work to deliver by their deadline and then backing into how much time is left for UX.
This sets up the entire team—not just UX—up for failure. It causes burnout, MVPs that are more “minimum” than “valuable”, decisions based on poor (or no) research, and a reputation with customers for delivering poor quality, which sometimes you can never recover.
It’s not uncommon for UX to be thrown under the bus for “subpar experiences” being delivered, or the throughput being too low, but the team struggles to be set up for success.
I think we would all agree that accountability and enablement have to go hand in hand.
How can senior leaders and product/engineering parters better enable their UX teams? How can UX leaders better set up their UXers up for success?
There are 3 ways I’ve found that make a significant dent in this problem: Establishing a shared UX effort framework, tracking & estimating UX work, and incorporating UX estimates into capacity planning.
1. Establish a shared framework for determining level of UX Effort.


One problem is that UXers and their partners often don’t have a shared language or criteria to use to evaluate the level of UX work needed (design and research) to be done in a given set of circumstances. Like with engineering, there is some flexibility but there also needs to be a certain amount of work that is required based on criteria like complexity, risk, and existing knowledge of the problem space.
My article How to Estimate and Prioritize UX Work describes at length a framework I created to solve this problem. It gives a common language to speak detailing, general t-shirt sizing, and common activities done at each level of effort, and which level is appropriate in which set of circumstances. For more details, give it a read.
2. Tracking UX work
It’s common when I start working with a new team to discover that they are not tracking work in a tool like Jira or Linear. Sometimes the work isn’t being tracked at all, and other times it’s being tracked at a really general/high level in a spreadsheet or similar. “That’s for engineers”, “Our work is more ambiguous”, or “We don’t always know what needs to be done at the beginning” are all common things I hear from these teams.
I get it. Engineering tasks are far more concrete. There’s a definite set of requirements. Their work is also the last step in the process and delivers “something real” to customers.
But, tracking UX work in a structured tool like Jira transforms design from an opaque, siloed activity into a predictable, integrated function. Moving away from ad-hoc task management provides distinct advantages, particularly for scaling design operations and proving the team’s strategic value.
Here are the top 10 advantages of migrating a UX team’s workflow into a tool like Jira:
1. Seamless cross-functional alignment
Jira operates as a shared source of truth, bridging the gap between product management, design, and engineering. By living in the same ecosystem as developers, UX teams ensure that design tickets are directly linked to product epics and development stories, reducing friction during handoff and ensuring nothing gets lost in translation.
2. High-level visibility and stakeholder reporting
Stakeholders rarely need to see the minutiae of a Figma file, but they do need to know the status of an initiative. Dashboards and automated reports provide executive visibility into project health, mitigating the need for constant status-update meetings and proving the team’s continuous output.
3. Standardized and repeatable workflows
A structured tool enforces consistency. By defining custom statuses (e.g., Intake, Discovery, Wireframing, Review, Ready for Dev), the team establishes a standardized operational rhythm. This consistency makes onboarding new designers easier and ensures every project goes through the necessary quality gates.
4. Centralized documentation and audit trails
Conversations happening in Slack or email often disappear. A ticketing tool centralizes the “why” behind design decisions. Attachments, comments, and linked Confluence pages create a durable audit trail of iterations, feedback, and approvals that anyone can reference months later.
5. Streamlined intake for ad-hoc requests
Unplanned requests are a major source of scope creep. Routing all requests through a standardized intake process or service desk within the tool forces requesters to provide necessary context upfront and allows design leadership to triage, accept, or reject work systematically.
6. Data-driven continuous improvement
Agile ceremonies like retrospectives are much more effective when grounded in data. Looking at sprint reports, bottleneck stages, or cycle times allows the team to pinpoint operational inefficiencies and iteratively refine how they work together.
7. Ruthless prioritization
A centralized backlog makes it easier to visually stack-rank work against business objectives. It prevents the team from operating on a “first-in, first-out” basis and ensures that high-impact strategic work takes precedence over low-priority tweaks.
8. Clear dependency management
Design work is rarely done in a vacuum. A UX task might be blocked by pending user research, missing product requirements, a technical limitation, or work by another team. Linking issues highlights these dependencies immediately, surfacing blockers before they derail the sprint.
9. Strategic resource allocation and capacity planning
For leadership, understanding team bandwidth is critical. Tracking work allows for an accurate view of who is over-allocated and who has capacity. This visibility makes it easier to assign the right designers to the right initiatives and protects the team from burnout by pushing back on unreasonable timelines with hard data.
10. Quantifiable throughput tracking, resource management, and capacity planning
When design tasks are broken down and estimated, it becomes possible to measure the team’s throughput and calculate the team’s capacity. Over time, this historical data enables much more accurate forecasting for future projects, enables teams to ensure they only take on the work they realistically can handle, and provides them with a data-informed way of demonstrating resource needs.
3. Capacity Planning
Capacity Planning is the process of right-sizing the “Total Project Demand” with the forecasted Team Capacity. Most UX teams have no idea what their capacity is. Fewer still have a process for calculating it and using it during quarterly planning activities with their counterparts in Product Management & Engineering to ensure teams don’t commit to more work than they can handle.
Of course, there’s a lot more that goes into a quarterly planning cycle than just calculating capacity. Strategy & OKRs have to be aligned on. Work has to be prioritized & estimated. The executive team needs an opportunity to provide input. Etc.
UX team structure to ensure success
In this article, I will avoid getting too technical on specific tools and how the process I will go over is implemented. It’s the process that is important, not which tool you implement it in. Plus, there is a lot of variation from company to company, and I don’t want to be overly prescriptive.
That said, there is a point worth considering regarding team structure and how UX fits in to the wider organization.
Historically, the prevailing wisdom has been the “Embedded Model” where each UXer is embedded into an engineering squad. It usually looks something like this:
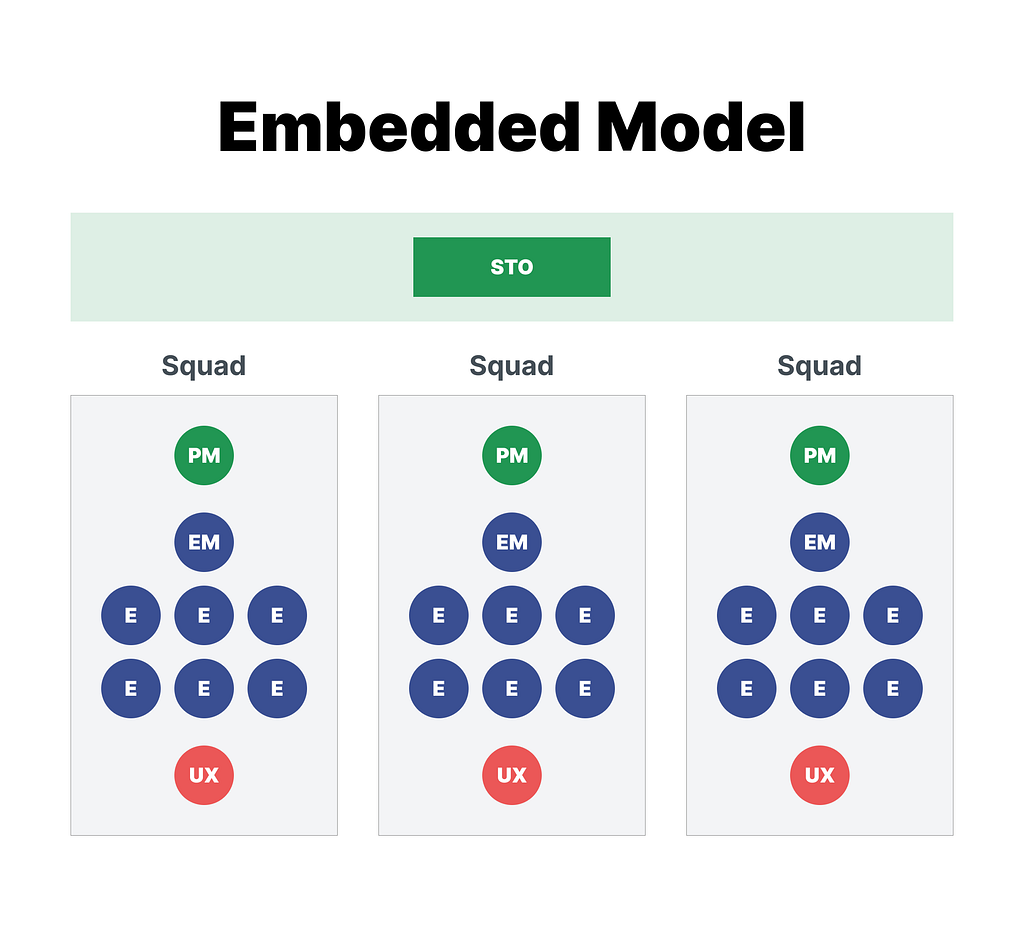
Over the years of operating in this way, I have found some problems with this approach.
- There’s almost never enough UXers to staff 1 per engineering team.
- It creates siloes within the UX org that require a lot of effort (and meetings) to overcome.
- It results in early career UXers being thrust into projects they’re not ready for and Lead UXers doing low level mockup work. (Since whatever work the squad needs is their responsibility).
- Most relevant to our discussion here: Capacity planning, dependency management, and throughput tracking gets extremely messy.
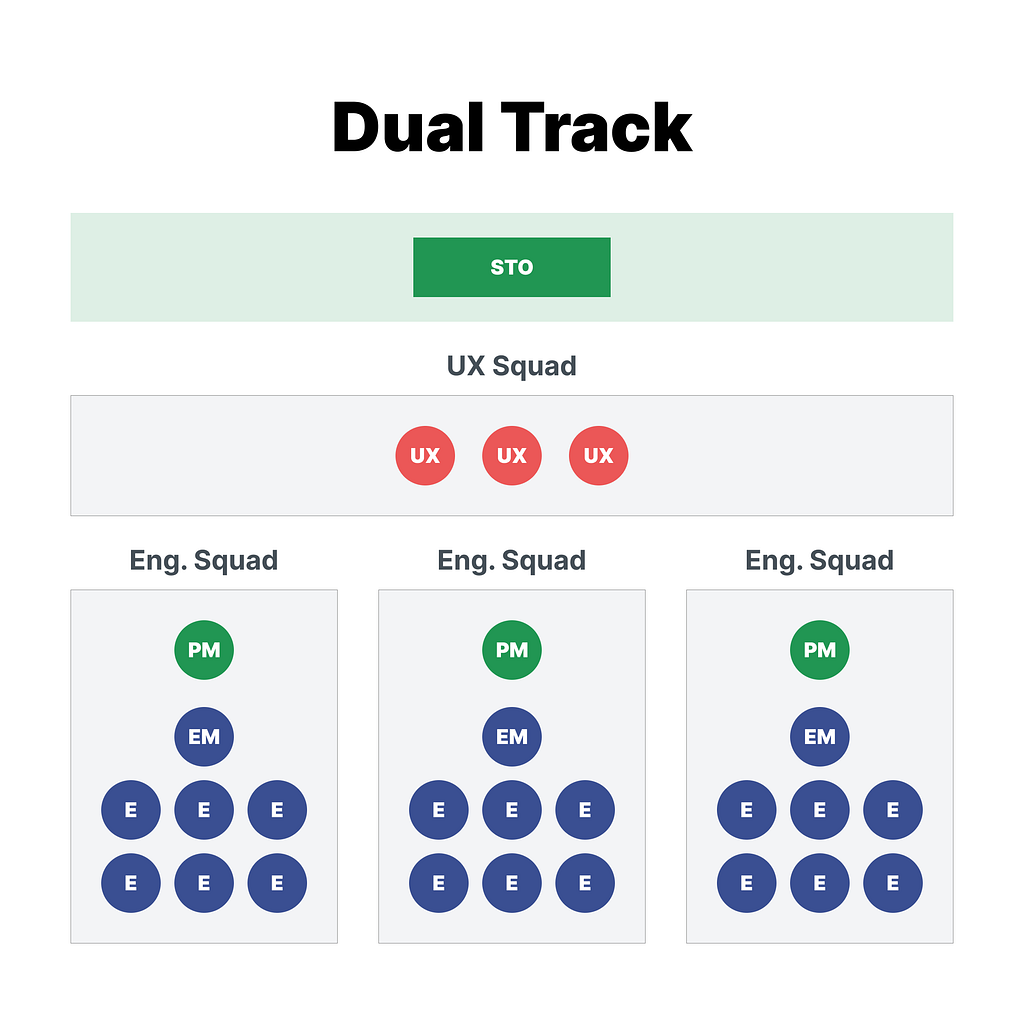
Instead, I recommend treating a UX team as an individual squad, separate from Engineering, assigned to an STO (sub domain) rather than embedded on the Engineering squad.
This allows:
- Clear Dependency Management
- Independent Capacity Tracking
- Better throughput tracking and transparency to partners
- Flexibility to assign the right UXer to the right project based on skill, level, and domain knowledge.
- More cross-pollination, and much fewer silos.
One objection many UX teams have to this idea is: “We like working hand in hand with Engineering. We’re 1 team, not 2.” I very much agree. However, you don’t need to be part of the same squad to operate as a unified team. In fact, I have found that by setting your UX team up as a separate squad, you actually improve the partnership, not limit it. Each squad has clear capacity, date, commitments, and dependencies on each other. When everything is mixed together, it’s harder to see. This often results in UX getting thrown under the bus or given insufficient time to get work done.
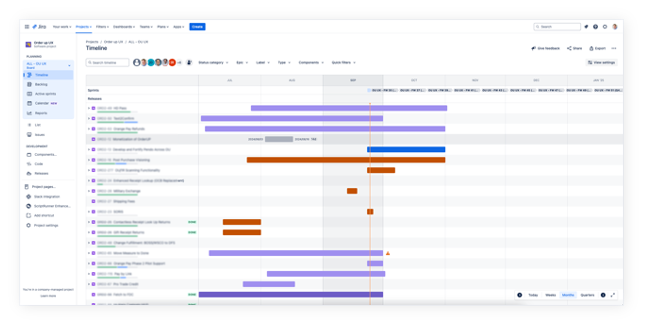
If you ARE able to work this way, this structure should be reflected in your Jira/Linear/etc setup. (You should have a separate “squad” for each UX Design & Research team). My current UX org of 25 is currently set up with the following UX Squads by “experience” (Product) :
- UX Ordering (Buyer, Marketplace product)
- UX Post Order (Buyer, Marketplace product)
- UX Partner (Partner, Marketplace product)
- UX Supplier Services (Ad Tech product)
- UX Design Systems
- UX Research
- UX Content
For the first 4, those correlate to our STOs. (1 UX squad per STO).
For the last 3, they operate with an additional layer of abstraction. Research and Content operate as distinct squads with their own capacity, commitments, etc. Some of them are embedded into an STO while others work on projects that span STOs. So there is some flexibility in this model.
If your company won’t support separate UX squads for now, you can still apply these concepts, but it might be a lot messier.
Ok. Let’s move onto the actual Capacity Planning process.
The 6 steps of proper capacity planning
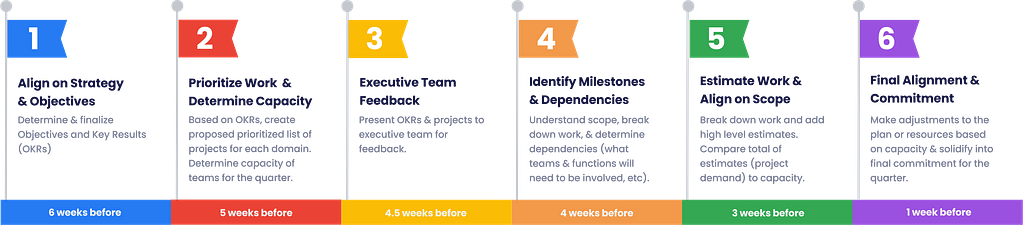
There are 6 key parts of a healthy planning process needed to set cross-functional teams (including UX) up for success:
- Align on strategy & OKRs
- Prioritize work & determine capacity
- Executive team feedback
- Identify milestones & dependencies
- Estimate work & align on scope
- Final alignment & commitment
Let’s consider each one in more detail.
1. Align on strategy & objectives
The first step is to align on the goals and metrics for the quarter. This should be done at least 6 weeks before the start of the quarter to allow sufficient time for all the steps.
Many companies use a goal-setting framework called OKRs (or Objectives and Key Results). The framework is built on two fundamental components:
- Objective: What you want to achieve. This is a qualitative, inspiring, and clear statement of intent.
- Key Results: How you will measure progress toward that objective. These must be quantitative, specific, and easily trackable (usually 3 to 5 key results per objective).
There are many books, courses, and articles about OKRs. One of my favorites is Who Does What By How Much: A Practical Guide To Customer-Centric OKRs by Jeff Gothelf and Josh Seiden
There are many goal-setting & strategic objective setting frameworks. If your company uses something else, that’s fine. The most important point is that before initiatives or projects can be determined, strategic objectives & north star metrics are needed. While these are likely set on an annual or even 3-year plan basis, it is important they are revisited each quarter.
2. Prioritize work & determine capacity
Propose projects
About 5 weeks before the start of the next quarter, teams should start creating a proposed list of of projects for the quarter and determining their capacity.
With the project list, the key is that the projects are seen as only the proposed list. Before we can do proper capacity planning, we need to have a prioritized list of project candidates. Unless you work at a small company, this likely will be multiple lists, one done by each team or domain. Exactly who or how this gets done will vary with the company, but it will probably look something like the PM or Product Director crafting the list with input from UX and Engineering.
It is very important that this list be rooted in the OKRs and be prioritized.
This part is pretty straightforward, so let’s move on to Determining Capacity.
Determine capacity
It’s important before you get too far in the planning cycle to determine the capacity of each team (or squad). Knowing team capacity helps you to have an idea early on how much work each team (UX & Engineering) can handle to help guide your roadmap commitments for the quarter.
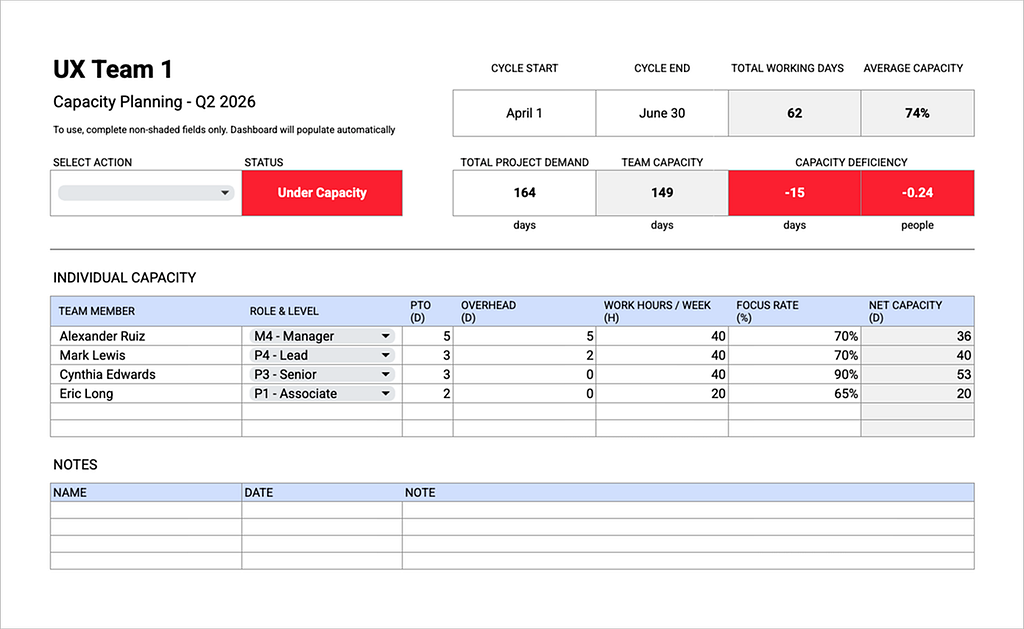
To help with that process, I have created a worksheet (which you can download here) that makes it easy to calculate capacity and compare with project demand.
Let me walk through how to use it.
STEP 1: Enter start date and end date of your cycle (quarter for many companies, but could also be month or another cadence). This will help calculate the number of available working days in the cycle.
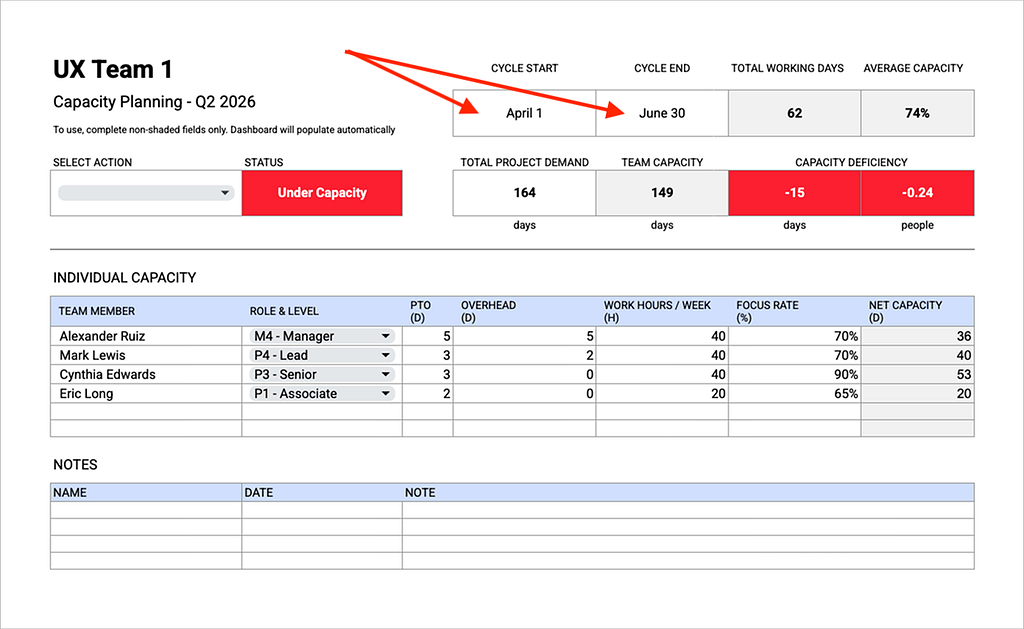
STEP 2: Navigate to the “Days Off” tab and enter in all your company holidays and other days you don’t want to count toward your capacity (like hackathons or company offsites). These days will automatically be filtered out of the Total Working Days calculation.

STEP 3: Now, head back to the team sheet and fill in the Individual Capacity table with the Name, Role & Level, # of PTO days planned for the quarter, Overhead, Work Hours per Week, and the Focus Rate.

NOTES:
- The purpose of PTO has nothing to do with approving PTO. It doesn’t need to be exact and this sheet isn’t intended to be the source of truth for PTO. The only intent is to filter out any days each person already knows they won’t be available during the quarter.
- Overhead time includes admin or management tasks that are necessary but not directly focused on delivering roadmap projects (and as a result should not be counted as available capacity). . You might think about this as “management” time. How I normally determine what to put is I think about what % of my time is spend with management tasks across the entire quarter and then enter the corresponding amount of days. For a Manager that often translates to 5%-10% or around 3–6 days per quarter. Lead/Staff level individual contributors often have some overhead, but not as much as a Manager. Senior and below usually don’t have Overhead.
- “Focus Rate” (or “Utilization Rate” at some companies) is entered as a percentage and is key to forecasting realistic capacity numbers. The idea is that even subtracting PTO and Overhead days, there is a cost to context switching, team meetings, miscellaneous unanticipated asks, etc that result in lost productivity. These are things that take up some time but for which we don’t put a task in the backlog. To allow for this we enter a “Focus Rate” which is the amount of time we will be working on (focused) on backlog work. (Or deducting a % of time to account for the things listed above). A good starting place for Focus Rate is 70%. It should be a little higher for independent team members with less distractions, and lower for those needing more guidance or who have more distractions, are newer to the team, etc. Think of Focus Rate as “what % of their time should they be spending on backlog work”.
Once you’ve entered all this in, the sheet will calculate your Team Capacity. This is the number you should plan work against.
NOTE: these are “person days”, not calendar days. The fact that 1 person day of work usually take multiple Calendar Days is why we adjust for Overhead, Focus Rate, etc.

3. Check in with the executive team
Between 4–5 weeks before the quarter starts, there should be a check in with leadership. Who this is will vary with the company, but it should be whichever cross-functional senior leaders have a stake in the roadmap and your commitments. If you’ve written your OKRs well and set them based on company strategy, there shouldn’t be too many surprises here. Usually the feedback amounts to changes in priority, rather than complete changes in direction. If there are changes in direction, though, it’s best to discover them early.
4. Identify milestones & dependencies
Identify dependencies

Around 4 weeks before the next quarter, after you have received feedback from the executive team and have made any adjustments to projects & priority ranking, the next step is to identify what teams need to contribute to the project to make it successful. If you’re organized into business units or Single Threaded Organizations (STOs), that might be the teams within the STO. It could be dependencies on other teams in other STOs. At the very minimum it should be 1 UX team and 1 Engineering team.
Determine milestones
Once you have your dependencies created & mapped, the next step is for each squad to identify milestones or “deliverables” that captures their part of the work. The way I recommend to track those dependencies is to create a team-specific (placeholder) epic under the initiative and assign it to the lead of that team.
That way, each UX squad will have an idea of which projects are requesting UX support. It is important to create separate milestones for design and research work. (If you have a separate UX Research squad, they will have their own
NOTE: One other advantage of the Dual Track UX Resourcing model is that it clearly signals your independence to commit to and maintain your own capacity separate from engineering. You’re not inventing your own priorities, but you do have the right to only commit to a doable workload. This becomes easier in the Dual Track model.
For each milestone, it is important to use the UX Effort framework to align with Product Management on which level of effort (LOE) each design and research milestone falls into. You don’t need to make detailed scope decisions here, but you do need to align on the high level LOE.
5. Align on scope & estimate work
Align on scope
At least 3 weeks before the next quarter, we should already have aligned on the UX LOE for each project. Now we need partner with Product Managers to understand what is in scope and out of scope so we can add estimates.
We don’t need full-blown multi-page Product Requirements Documents (PRDs), but there is some information we do need from PMs before we can break down work.

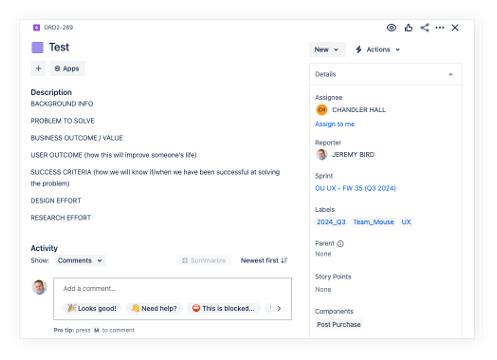
The type of information and where it is documented will vary company-to-company. I highly recommend aligning with partners on a template and where you will document this. I advocate for something like this:
- Background info (what does someone need to know to understand what we are doing)
- Problem to solve (what are we doing and why does it matter)
- Business outcome / Value (how will this enable our strategic goals / OKRs)
- User outcome (how this will improve someone’s life)
- Success criteria (how we will know if/when we have been successful at solving the problem)
- Design level of effort
- Research level of effort
It is not all on the PM to provide all this information in a silo, but they should come with a plan on at least the first 3, and then partner with UX on the rest. Whenever possible, I try to include what is In Scope and Out of Scope under the Problem To Solve. How exactly you arrive at this information is up to you and your partners, but you do need to have it aligned on at least 1–2 weeks before the next quarter starts. A good rule of thumb when determining what information you need is to consider: “What information do I need to be able to provide a realistic estimate?”
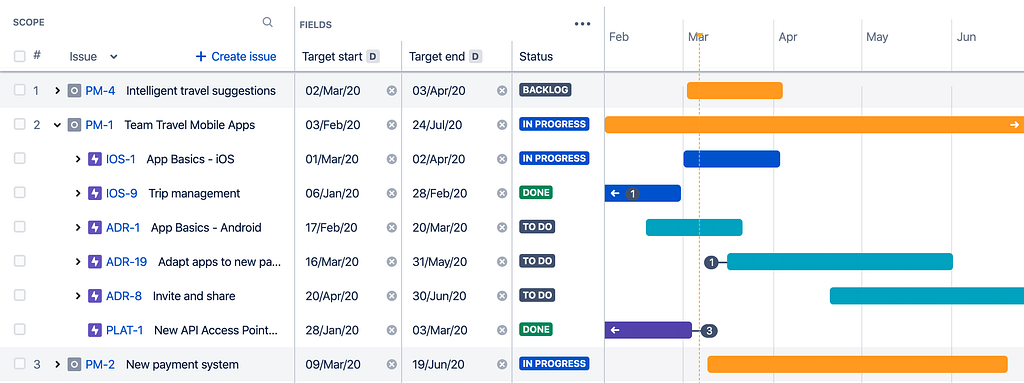
Add estimates
Once you have all the scope alignment complete, you need to estimate the work. The level of fidelity will vary, but at a minimum you need to estimate the work at the Epic (milestone) level. If you have time, I recommend breaking your epics into backlog items (stories or tasks) and estimating each smaller chunk. You will need these prior to the quarter starting anyway, but if you’re in a time crunch estimating at the epic level can work too. I strongly recommend estimating in Days rather that Story Points. It is far easier to compare with capacity that way. If your org uses story points, though, that can work. You just might need to do a translation.
Once you have all your estimates entered, add them all up and enter that value in the “Total Project Demand” field on the spreadsheet.

NOTE: I have seen teams record their projects on a spreadsheet like this as well. I have avoided that since I prefer to have Jira/Linear be the source of truth. If you’d like, it is possible to write a script to for this spreadsheet to pull in Total Project Demand from Jira/Linear.
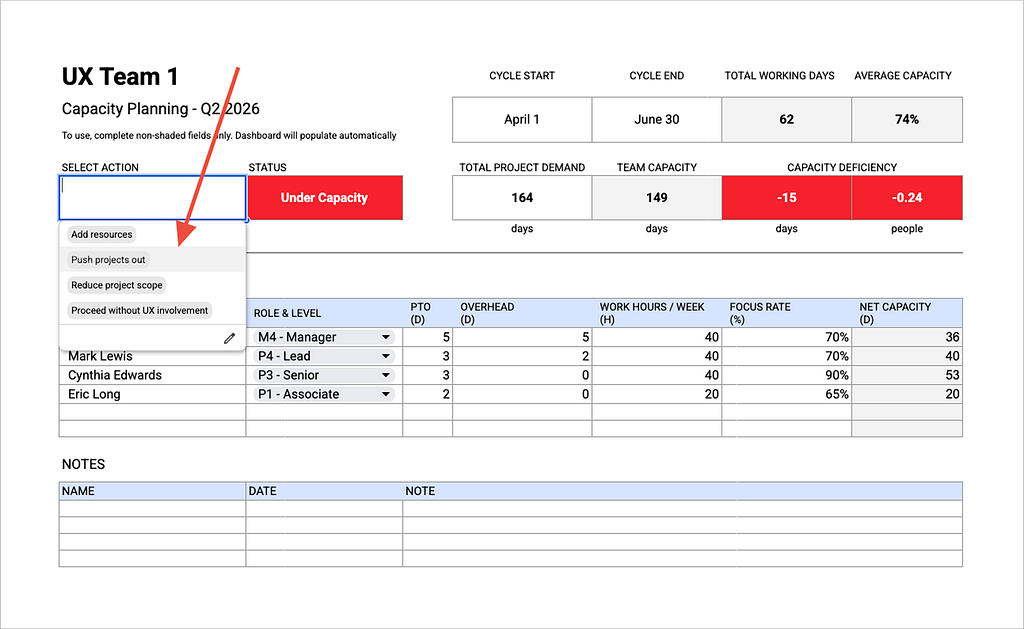
Now will all the info entered, you can compare your Team Capacity against your Total Project Demand. The sheet shows you whether you’re Under Capacity, Over Capacity, or At Capacity and by how much. Being within 5% of Total Working days over or under is reflected as “At Capacity”.
In addition to +/- Days there is also how many People you are over/under. This takes your Capacity Deficiency or Surplus and divides by your Average Capacity. This can help the conversation of what action to take to resolve the capacity discrepancy.
6. Final alignment & commitment
At least 1–2 weeks before the start of the next quarter, it’s vital to have conversations with your partners (and especially Product/Engineering leaders) about the discrepancy (over or under) in your capacity, align how to resolve them, and finalize commitments.
How to resolve capacity discrepancy
Being Under Capacity means that the Total Project Demand (your project estimates) are higher than your projected capacity. To resolve this, you have 4 choices:
- Add additional resources (hiring or moving a resource in from another team)
- Push project(s) out (move project(s) out to another quarter)
- Reduce project scope (if that’s possible while still delivering something valuable).
- Proceed without UX involvement (but make sure expectations are set on the ramifications. UX can’t be held accountable for quality on this initiative if they’re not involved. Avoid this when possible.)
The first 2 choices are preferable, but the others can be used in extenuating circumstances. After all, the point of using the UX Effort Framework was to right-size the level of effort needed for the circumstances. If a project falls off the available capacity based on priority, it probably should be move out of the quarter. If it can’t be moved out of the quarter, secure additional resources somehow.
Being over capacity means your projected Team Capacity is higher than Total Project Demand. To resolve this, you have 3 choices:
- Increase project scope (include more than you were planning to have time to do).
- Reduce resources (send a squad member to help another squad who is Under Capacity, either full-time or part-time)
- Take on more projects (remember, it is OK to do UX work in a different quarter than the engineering team will be able to implement it)
Deciding how to proceed will likely take some back and forth with your partners and leadership. To help keep track of it all, I’ve provided a notes section on the sheet.
When you have decided which resolution to take, update the Select Action field.
Final commitment & unplanned additions
There are other inputs that product teams often use to determine final commitment such as Business Value, # of Customers Impacted, Revenue Impact, etc. I am intentionally not bringing those into this framework since they tend to vary from company to company.
After resolving the Capacity Surplus or Deficiency, you will have a final commitment for the quarter. It’s vital that all work be accounted for in this plan. If you haven’t already done so, this is now the time to break epics into stories/tasks and assign them out to team members. It’s also important to take into account individual capacity. If you have 149 points of estimates of Lead-level work, but you only have 1 Lead, that’s probably not going to work out well.
Conclusion & tips
During the quarter new projects will need to get added or removed (it always happens). In those situations, estimate the work that needs to be brought in, then look at your capacity sheet to figure out what work can be pushed out to make room for the new work. You don’t have unlimited capacity, and pretending you do will end up in burnout, increased turnover, and low quality work.
Whenever someone comes to me and says “we need to do X” (unplanned work), my answer is always: “Absolutely! What project would you like to de-prioritize to make room for the extra [# of days] of capacity?”
Another way I often use this Capacity Planning sheet is to break work into sprints. I take a look at an individual’s net capacity divided by 6 (2-week sprints in a quarter), and that gives me about how many person days of work I should assign to an individual per sprint. If they consistently deliver more than that, I know I need to look at how I’m estimating or at the Focus Rate for that individual. As you have more historical data to look at, you will be able to fine tune this resulting in fewer discrepancies and more accurate estimating.
Also, this 6-step process will need to be customized to fit into your existing process. The important parts are 4 things:
- Calculate your capacity in a realistic way (feel free to use this spreadsheet to help if you’d like)
- Estimate your work
- Compare your Total Project Demand with your Team Capacity
- Align with partners on how to resolve discrepancies between the 2.
I hope you can see how working this way can set your UX team up for success and will solve so many challenges UX teams often face. It requires a little extra work (what some designers call “busy work”), but the ROI of that extra work is extremely high.
Got a question about this topic? Need a UX, Product Design, or Research leader to help improve your UX operations? Looking for 1:1 mentoring services? Connect with me on LinkedIn, check out my portfolio, or send me an email.
![]()
Integrating UX into capacity planning was originally published in UX Collective on Medium, where people are continuing the conversation by highlighting and responding to this story.
This post first appeared on Read More