As Java developers, we often say that memory management is handled automatically by the JVM. That statement is true, but it can also create a dangerous comfort zone.
Garbage Collection is not something we should completely ignore just because the JVM handles it for us. In production systems, especially backend applications running APIs, schedulers, integrations, and long-running services, GC behavior can directly affect application latency, throughput, memory usage, and overall stability.
During my journey as a Java developer, I have worked mostly on backend systems where applications are expected to run continuously, process requests reliably, and handle data movement between different systems. In such environments, understanding Garbage Collection is not only useful for interviews, but also important for debugging real production issues.
This article is my attempt to explain Java Garbage Collection from an intermediate and practical point of view.
What Is Garbage Collection in Java?
Garbage Collection is the JVM’s automatic memory management process. It identifies objects in heap memory that are no longer reachable by the application and reclaims that memory.
In simple terms, when an object is no longer used or reachable, it becomes eligible for garbage collection. Without Garbage Collection:
- Memory usage would keep increasing.
- Applications could eventually fail with OutOfMemoryError.
- Developers would need to manually allocate and deallocate memory, similar to languages like C or C++.
- Memory leaks and dangling references would become much harder to manage.
However, automatic memory management does not mean free memory management. GC has a cost. The JVM must spend CPU time identifying live objects, cleaning unused ones, and sometimes reorganizing memory. That cost becomes visible in production when GC pauses become frequent or long.
The Core Idea: Reachability
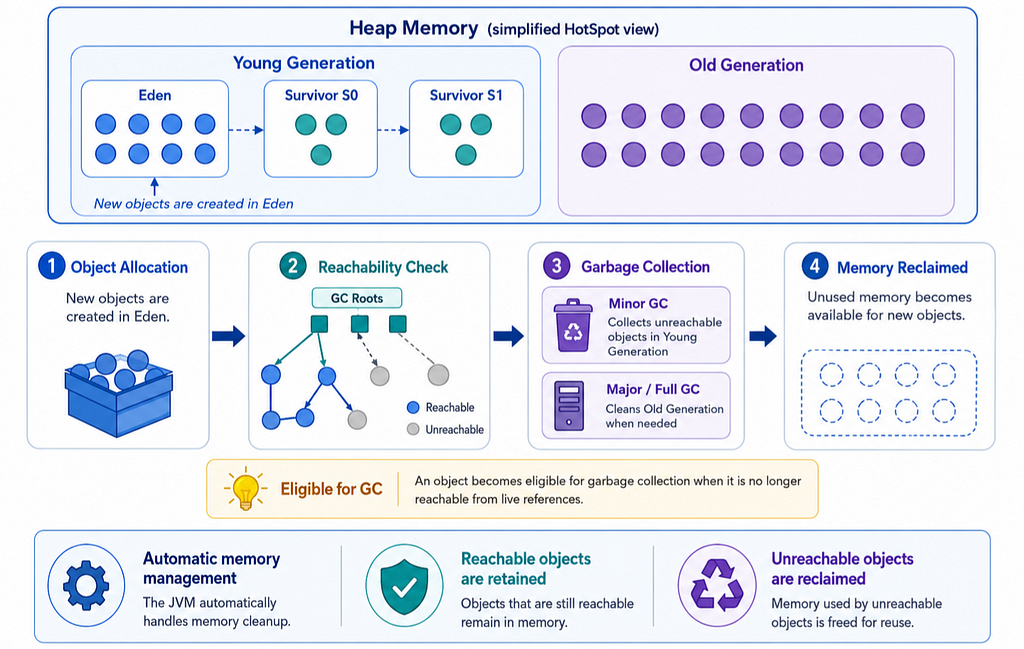
The JVM does not randomly delete objects. It determines whether an object is alive based on reachability. An object is considered alive if it can be reached directly or indirectly from a set of special references called GC Roots.
Common GC Roots include:
- Local variables in active stack frames
- Active threads
- Static variables
- JNI references
If an object is reachable from GC Roots, the JVM treats it as alive and does not collect it. If it is not reachable, it becomes eligible for garbage collection.
This is an important point: Java GC does not check whether an object is “needed” from a business perspective. It only checks whether the object is reachable from the application’s reference graph.
That is why memory leaks can still happen in Java. If an object is no longer useful but is still referenced by a static collection, cache, listener, thread-local, or long-living object, the JVM cannot collect it.
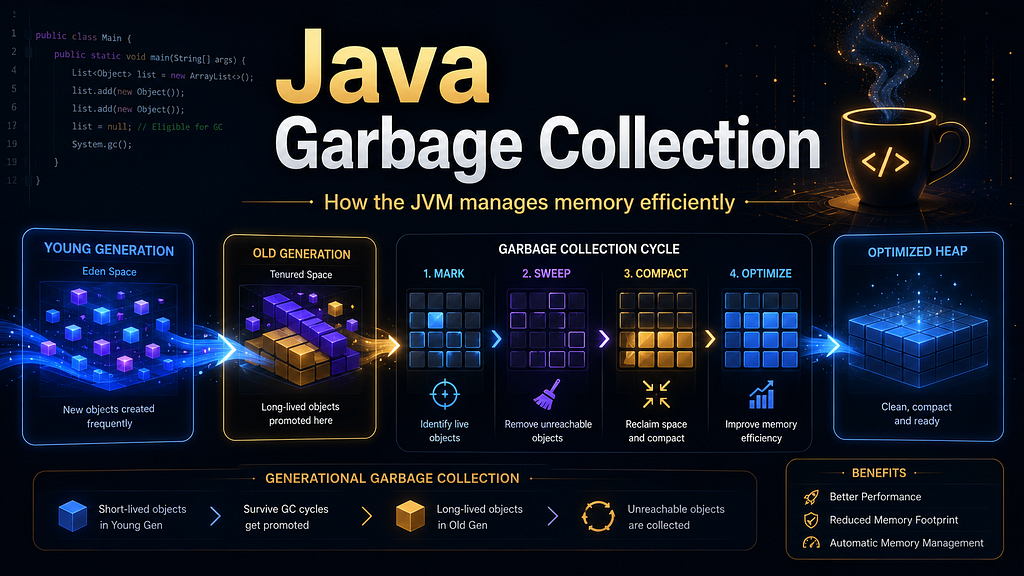
Mark, Sweep, and Compact
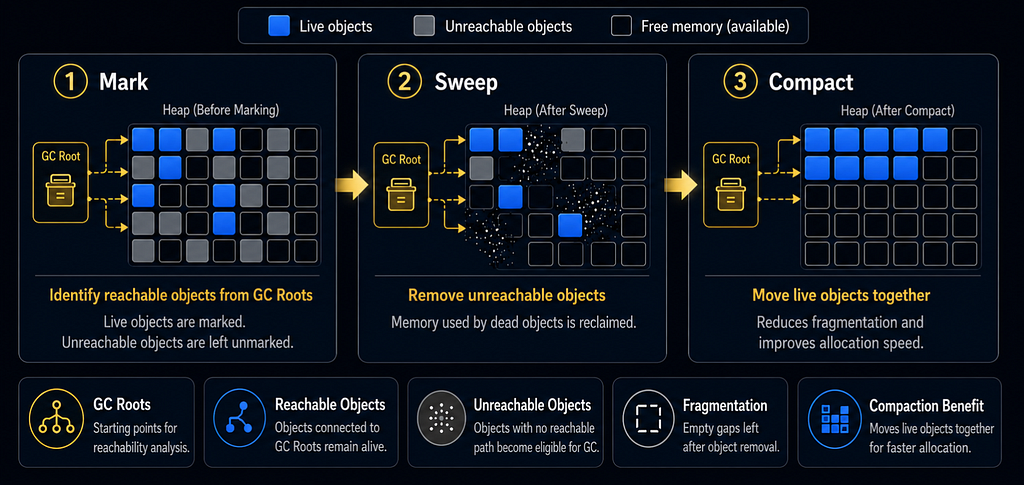
Most Garbage Collection concepts can be understood through three core operations: Mark, Sweep, and Compact.
1. Mark
In the marking phase, the JVM starts from GC Roots and traces all reachable objects. These reachable objects are marked as live.
Objects that are not reachable are considered dead. This phase answers the question: Which objects are still alive?
2. Sweep
In the sweeping phase, the JVM removes unreachable objects and frees the memory occupied by them. This phase answers the question: Which memory can be reclaimed?
3. Compact
After sweeping, memory can become fragmented. There may be free spaces scattered across the heap. Compaction moves live objects closer together so that larger continuous blocks of memory become available. This phase answers the question: How can memory be reorganized for faster future allocation?
A simple way to summarize this is: Mark finds live objects, Sweep removes dead objects, and Compact reduces memory fragmentation.
This model is fundamental, but using Mark–Sweep–Compact on the entire heap every time would be expensive. That is where generational garbage collection becomes important.
Why Generational Garbage Collection Exists
In most applications, many objects are short-lived. For example, in a backend API, objects created for request processing, DTO mapping, JSON serialization, validation, database response handling, and temporary calculations often become useless shortly after the request is completed.
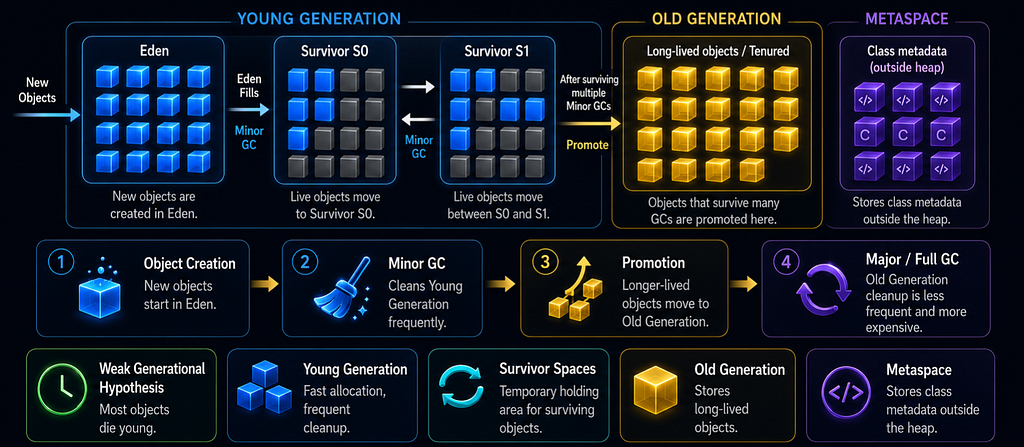
This behavior is known as the Weak Generational Hypothesis: Most objects die young, and only a small number of objects live long.
The JVM uses this idea to divide heap memory into generations.
Instead of scanning the entire heap every time, the JVM separates objects based on their age and collects younger objects more frequently.
This improves performance because the JVM focuses more often on the area where garbage is most likely to be found.
Young Generation and Old Generation
Java heap memory is commonly divided into two main areas:
- Young Generation
- Old Generation
There is also Metaspace, which is not part of the Java heap but is important in JVM memory management.
Young Generation: Where New Objects Start
Most new objects are created in the Young Generation. The Young Generation is further divided into:
- Eden Space
- Survivor Space S0
- Survivor Space S1
A typical object flow looks like this:
- A new object is created in Eden.
- When Eden becomes full, Minor GC runs.
- Dead objects are removed.
- Live objects are moved to a Survivor space.
- Objects that survive multiple Minor GCs are promoted to the Old Generation.
At any given time, one Survivor space is usually empty. The JVM uses the Survivor spaces to copy live objects back and forth during Minor GC.
This copying approach is efficient because most objects in the Young Generation die quickly. The JVM does not need to spend too much effort preserving them.
Minor GC
Minor GC is the garbage collection process that cleans the Young Generation. It happens frequently because new objects are continuously created in most Java applications. Minor GC is usually faster than Old Generation collection because the Young Generation is smaller and most objects there are short-lived. However, Minor GC can still cause Stop-the-World pauses. In a high-throughput application, frequent Minor GCs may indicate heavy object allocation. For example, repeatedly creating unnecessary temporary objects inside loops, request flows, schedulers, or data transformation layers can increase GC pressure.
Old Generation: Where Long-Lived Objects Stay
Objects that survive multiple Minor GC cycles are promoted to the Old Generation.
The Old Generation stores long-lived objects such as:
- Application-level objects
- Cached data
- Long-living collections
- Objects referenced by singleton beans
- Objects retained by active threads or static references
Garbage collection in the Old Generation is more expensive because objects here are expected to live longer, and the memory area is usually larger.
Major GC and Full GC
Major GC generally refers to garbage collection in the Old Generation.
Full GC usually refers to a more expensive collection involving the entire heap, including both Young and Old generations. Depending on the collector and JVM implementation, terminology can vary, but from a production perspective, the key point is this: Old Generation and Full GC events are usually more expensive and more dangerous for latency than Minor GC.
A Full GC can cause a long Stop-the-World pause. In production systems, long Full GC pauses can result in slow API responses, request timeouts, delayed schedulers, and poor user experience.
Stop-the-World: The Pause Developers Should Care About
Stop-the-World, often called STW, is a phase where application threads are paused so that the JVM can safely perform garbage collection work.
During this time:
- Business logic is paused.
- User requests may wait.
- Application processing is temporarily stopped.
- GC threads perform the required memory work.
STW is necessary because the JVM needs a consistent view of object references. If application threads keep modifying references while the JVM is tracing objects, memory analysis can become inconsistent.
Stop-the-World pauses can happen during:
- Minor GC
- Major GC
- Full GC
- Initial marking
- Final remark
- Compaction phases
Modern collectors try to reduce STW time by doing more work concurrently with application threads. But even modern collectors may still have short pause phases. From a production point of view, GC is not only about freeing memory. It is also about controlling pause time.
Metaspace: Replacement for PermGen
Before Java 8, class metadata was stored in Permanent Generation, commonly called PermGen. PermGen had a fixed size and could cause errors such as:
OutOfMemoryError: PermGen space
From Java 8 onward, PermGen was replaced by Metaspace. Metaspace stores class metadata outside the Java heap and can grow dynamically, depending on system memory and JVM configuration.
This reduced many PermGen-related memory issues, but it does not mean Metaspace is unlimited. Applications that dynamically load too many classes, frameworks, proxies, or classloaders can still face Metaspace-related memory problems.
Generational GC vs Mark–Sweep–Compact
One common confusion is treating Generational GC and Mark–Sweep–Compact as the same thing.
They are related, but they are not the same.
Generational GC is a memory management strategy. It decides how the heap is divided and how frequently different areas should be collected.
Mark–Sweep–Compact is a set of cleaning algorithms. It defines how the JVM identifies live objects, removes dead objects, and reorganizes memory.
A practical way to remember this is:
Generational GC decides where and how often to collect.
Mark–Sweep–Compact decides how the cleanup happens.
This separation is important because different garbage collectors use different strategies and algorithms internally.
Types of Garbage Collectors in Java
The JVM provides different garbage collectors for different application needs. There is no single collector that is perfect for every workload.
Choosing a collector depends on what the application values more:
- Throughput
- Low latency
- Small memory footprint
- Predictable pause time
- Large heap support
Serial Garbage Collector
The Serial Garbage Collector uses a single thread for garbage collection. It is simple and has low overhead, but it causes Stop-the-World pauses and is not suitable for high-traffic server applications.
It is mainly useful for:
- Small applications
- Simple standalone programs
- Environments with limited resources
For modern backend services, Serial GC is usually not the preferred choice.
Parallel Garbage Collector
The Parallel Garbage Collector uses multiple threads for garbage collection. Its main goal is throughput. It tries to maximize the amount of work done by the application compared to the time spent in GC.
Parallel GC can be suitable for:
- Batch processing systems
- Jobs where throughput matters more than latency
- Applications where longer pauses are acceptable
However, it still causes Stop-the-World pauses. So, for latency-sensitive APIs, we need to be careful.
CMS Garbage Collector
CMS stands for Concurrent Mark Sweep.
It was designed to reduce pause times by doing part of the GC work concurrently with application threads. CMS was useful for older low-latency systems, but it had some limitations, especially memory fragmentation because it did not compact memory regularly.
CMS was deprecated and later removed from modern Java versions. For current systems, G1, ZGC, and Shenandoah are more relevant choices.
G1 Garbage Collector
G1 stands for Garbage First.
G1 is a region-based garbage collector. Instead of dividing the heap into fixed Young and Old memory areas, it splits the heap into many equal-sized regions.
These regions can dynamically act as:
- Eden regions
- Survivor regions
- Old regions
- Free regions
This gives G1 more flexibility. G1 identifies regions with the most garbage and collects them first. That is why it is called Garbage First.
One important point is that G1 is still generational, but it does not use the traditional fixed Young and Old layout. The generations are built dynamically using heap regions.
G1 performs:
- Young GC
- Concurrent marking
- Mixed GC
In G1, Mixed GC is especially important. Instead of performing a traditional Major GC over the entire Old Generation, G1 can collect Young regions along with selected Old regions that contain a high amount of garbage.
This helps G1 provide more predictable pause times compared to older collectors.
G1 is commonly used for:
- Microservices
- Cloud-based applications
- Applications with medium to large heaps
- Systems that need a balance between throughput and predictable pauses
ZGC
ZGC is designed for low-latency Java applications.
It performs most expensive GC work concurrently with application threads and aims to keep pause times very low, even with large heaps. This makes it useful for applications where long pauses are unacceptable.
ZGC is suitable for:
- High-scale systems
- Latency-sensitive services
- Applications with large heaps
- Systems where response time consistency is important
One important version-related point is that ZGC has evolved over time. Earlier ZGC was non-generational, but modern Java versions introduced Generational ZGC. In JDK 21, Generational ZGC was introduced, and in JDK 23, generational mode became the default mode for ZGC.
So instead of explaining ZGC using the traditional Minor GC and Major GC model, it is better to say: ZGC is a modern, region-based, mostly concurrent collector. In recent Java versions, it can maintain separate young and old generations, but its design and behavior are different from traditional collectors such as Serial, Parallel, or CMS.
Shenandoah GC
Shenandoah is another low-pause garbage collector.
It performs concurrent compaction, meaning it can move objects while application threads continue running. This helps reduce long Stop-the-World pauses.
Shenandoah is useful for:
- Latency-sensitive services
- Applications with large heaps
- Systems where predictable pause time matters
Like ZGC, Shenandoah moves away from the traditional Minor/Major GC model and focuses on concurrent collection.
Production Thinking: What Should Java Developers Watch?
Understanding GC theory is useful, but production systems require observation.
As Java developers, we should pay attention to:
- Frequent Full GC events
- Long Stop-the-World pauses
- Increasing Old Generation usage
- High allocation rate
- Memory not dropping after GC
- OutOfMemoryError
- Thread dumps during high memory pressure
- Heap dumps for memory leak analysis
- GC logs for pause time and collection frequency
For example, if Old Generation keeps growing and does not reduce after GC, it may indicate that objects are being retained unintentionally.
Possible causes include:
- Static collections
- Unbounded caches
- Improper use of ThreadLocal
- Listeners not removed
- Large objects stored longer than required
- ClassLoader leaks
- Holding references inside singleton beans
GC logs, heap dumps, and thread dumps are very useful in such situations. A production issue cannot be solved only by knowing the definition of Minor GC or Major GC. We need to connect GC behavior with application code and runtime memory patterns.
My Practical Understanding
For me, Garbage Collection is not just a JVM background process. It is part of application performance.
When we write backend applications, we create objects continuously. Every request, database call, API response, scheduler execution, and transformation logic contributes to object allocation.
The JVM does a great job managing memory, but poor coding decisions can still create GC pressure.
Some practical habits that help are:
- Avoid unnecessary object creation in hot paths.
- Be careful with large collections.
- Use caches with proper eviction policies.
- Avoid storing request-specific data in static variables.
- Clean up ThreadLocal values after use.
- Monitor GC logs in performance-sensitive systems.
- Analyze heap dumps when memory keeps growing.
- Choose the right GC based on workload needs.
A developer does not need to tune the JVM for every small application. But for production services, it is important to understand what the JVM is doing behind the scenes.
Conclusion
Java Garbage Collection is one of the most important features of the JVM, but it should not be treated as magic.
At a basic level, GC identifies unreachable objects and frees memory. At a deeper level, it affects application performance, latency, throughput, and production stability.
The key concepts to understand are:
- GC Roots define object reachability.
- Mark, Sweep, and Compact are core cleanup operations.
- Generational GC improves performance by separating short-lived and long-lived objects.
- Minor GC usually refers to cleaning the Young Generation in traditional generational collectors.
- Major GC and Full GC are usually more expensive than Minor GC, but the exact meaning can vary depending on the JVM version and garbage collector.
- Stop-the-World pauses can directly affect application response time.
- G1, ZGC, and Shenandoah are modern collectors designed to improve pause-time behavior for production applications.
The exact behavior of Garbage Collection depends on the JVM version, selected collector, heap configuration, and workload. In production, GC behavior should always be analyzed using GC logs, metrics, heap dumps, thread dumps, and real application performance data.
As Java developers, we do not manually free memory, but we are still responsible for writing memory-conscious code.
The JVM manages memory automatically. But production-quality Java development requires understanding how that memory is managed.
![]()
Understanding Java Garbage Collection Beyond the Basics: A Production-Focused Perspective was originally published in Javarevisited on Medium, where people are continuing the conversation by highlighting and responding to this story.
This post first appeared on Read More