
Introducing Query Shape Insights in MongoDB Atlas
As modern applications scale, databases are often the first to show signs of stress, especially when query patterns shift or inefficiencies arise. MongoDB has invested in building a robust observability suite to help teams monitor and optimize performance. Tools such as the Query Profiler and, more recently, Namespace Insights provide deep visibility into query behavior and collection-level activity. While powerful, these capabilities primarily focus on individual queries or collections, limiting their ability to surface systemic patterns that impact overall application performance.
Today, MongoDB is excited to announce Query Shape Insights, a powerful new feature for MongoDB Atlas that offers a high-resolution, holistic view of how queries behave at scale across clusters. Query Shape Insights delivers a paradigm shift in visibility by surfacing aggregated statistics for the most resource-intensive query shapes. This accelerates root cause analysis, streamlines optimization workflows, and improves operational efficiency.
A new granularity for performance analysis
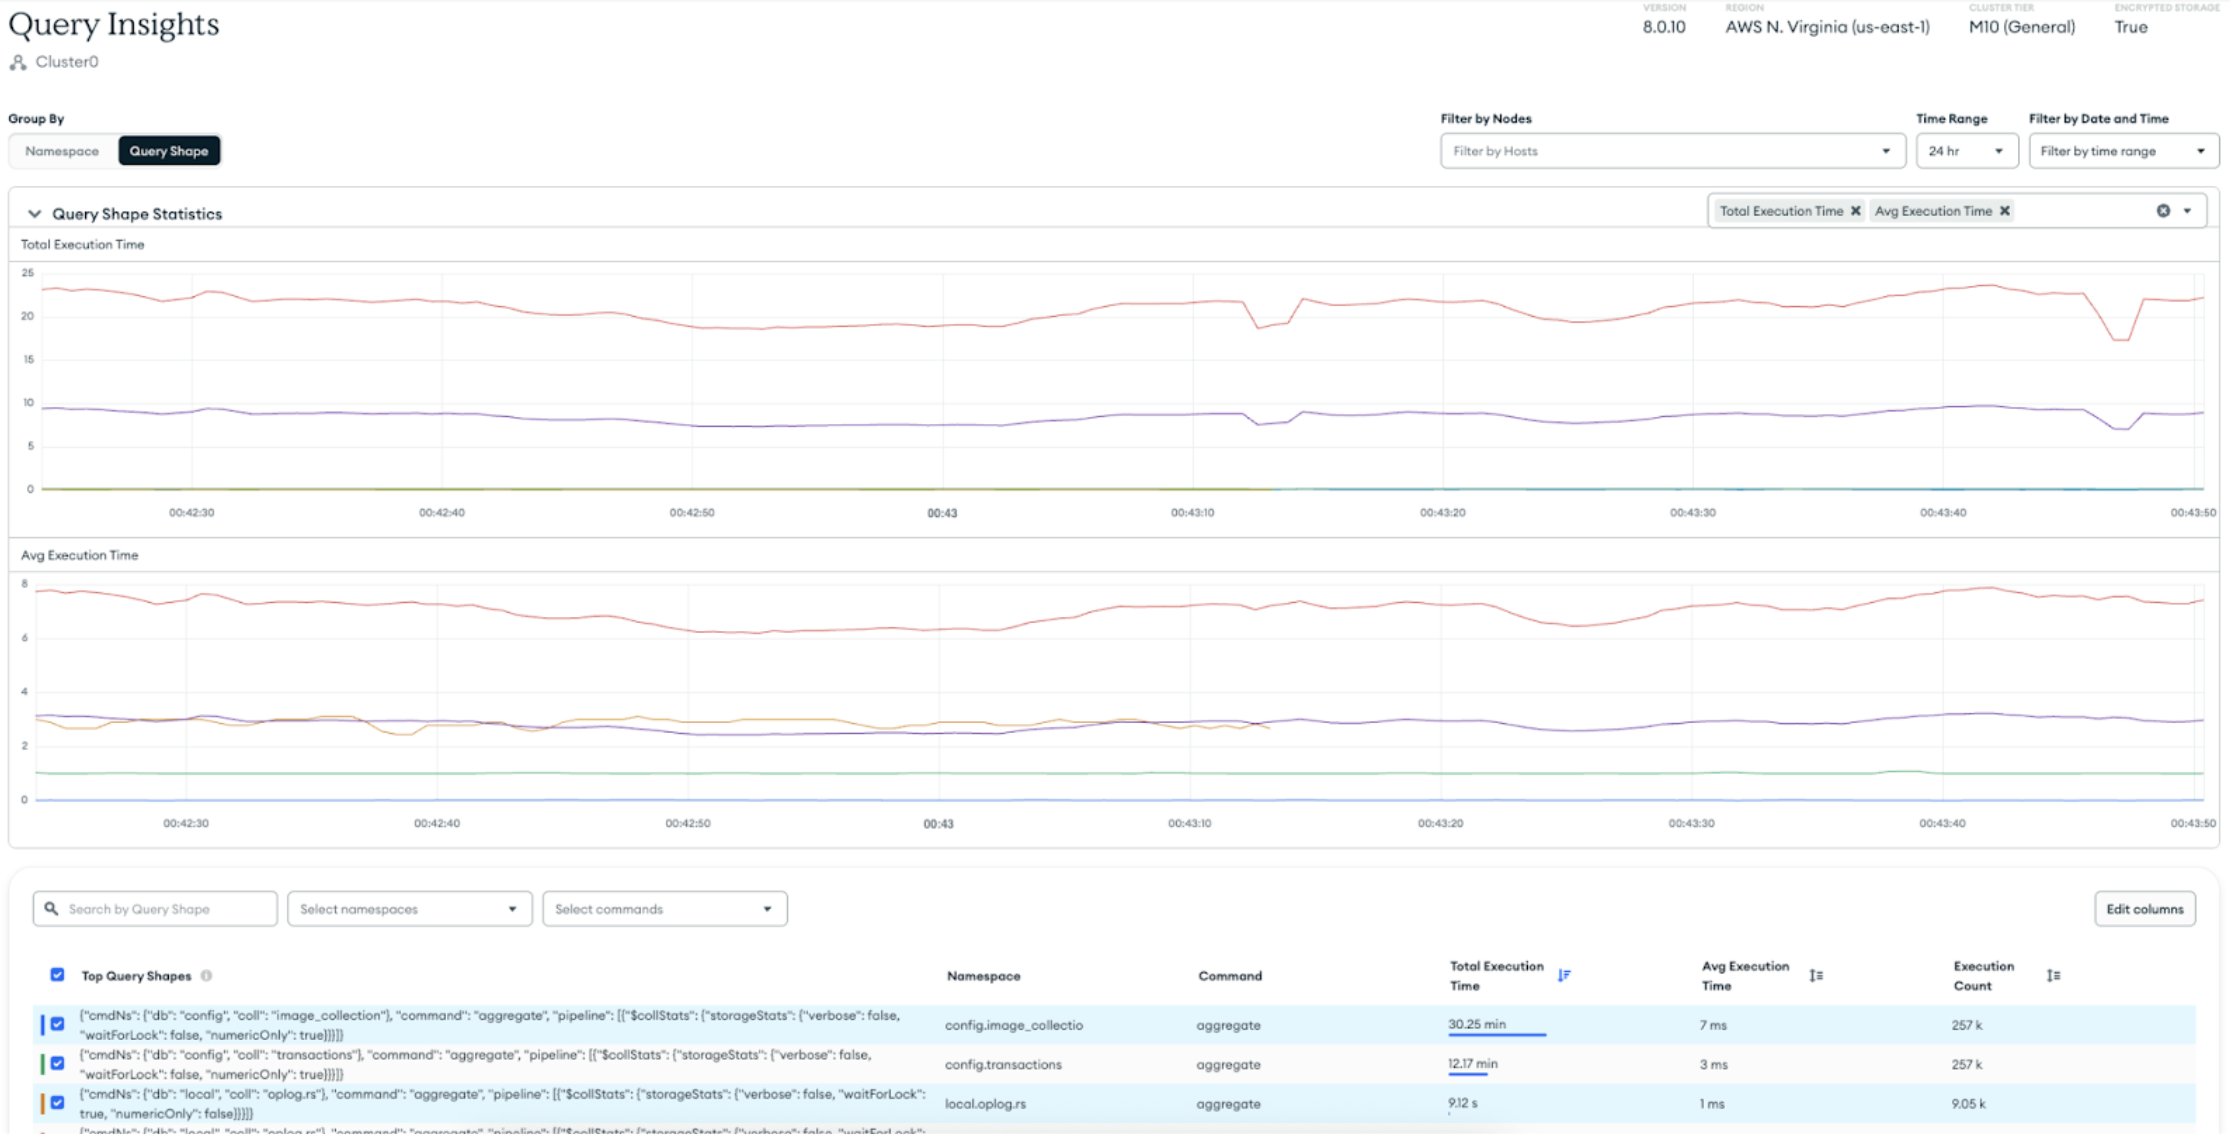
Previously, if a modern application experienced a traffic surge, it risked overloading the database with queries, causing rapid performance degradation. In those critical moments, developers and database administrators must quickly identify the queries contributing most acutely to the bottleneck. This necessitated scrutinizing logs or per-query samples. With the launch of Query Shape Insights, the top 100 query shapes are surfaced by grouping structurally similar queries with shared filters, projects, and aggregation stages into defined query shapes. These query shapes are then ranked by total execution time, offering MongoDB Atlas users greater visibility into the most resource-intensive queries.
Each query shape is enriched with detailed metrics such as execution time, operation count, number of documents examined and returned, and bytes read. These metrics are rendered as time series data, enabling developers and database administrators to pinpoint when the regressions began, how long they persisted, and what triggered them.
This new feature integrates seamlessly into the performance workloads teams use to monitor, debug, and optimize applications. Each query shape includes associated client metadata, such as application name, driver version, and host. This empowers teams to identify which services, applications, or teams impact performance. This level of visibility is particularly valuable for microservices-based environments, where inefficiencies might manifest across multiple teams and services.
Query Shape Insights adapts based on cluster tier to support varying workload sizes. Teams can analyze the performance data of each query shape over a 7-day window. This enables them to track trends, find changes in application behavior, and identify slow regressions that might otherwise be missed.
Integration with MongoDB’s observability suite
Query Shape Insights was designed to enable MongoDB Atlas users to move from detection to resolution with unprecedented speed and clarity. Built directly into the MongoDB Atlas experience, this feature is a clear starting point for performance investigations. This is imperative for dynamic environments where application behavior evolves rapidly and bottlenecks must be identified and resolved rapidly.
The Query Shape Insights dashboard offers comprehensive, time series–based analysis of query patterns across clusters. It enables teams to detect inefficiencies and understand when and how workloads have changed. Query Shape Insights answers critical diagnostic questions by surfacing the most resource-intensive query shapes. It identifies the workloads that consume the most resources and can help determine whether these workloads are expected or anomalous. Query Shape Insights can also help identify the emergence of new workloads and reveal how workloads have changed over time.
To support this level of analysis, Query Shape Insights offers a rich set of capabilities, giving teams the clarity and speed they need to troubleshoot intelligently and maintain high-performing applications:
-
Unified query performance view: Monitor query shapes to rapidly identify and investigate bottlenecks.
-
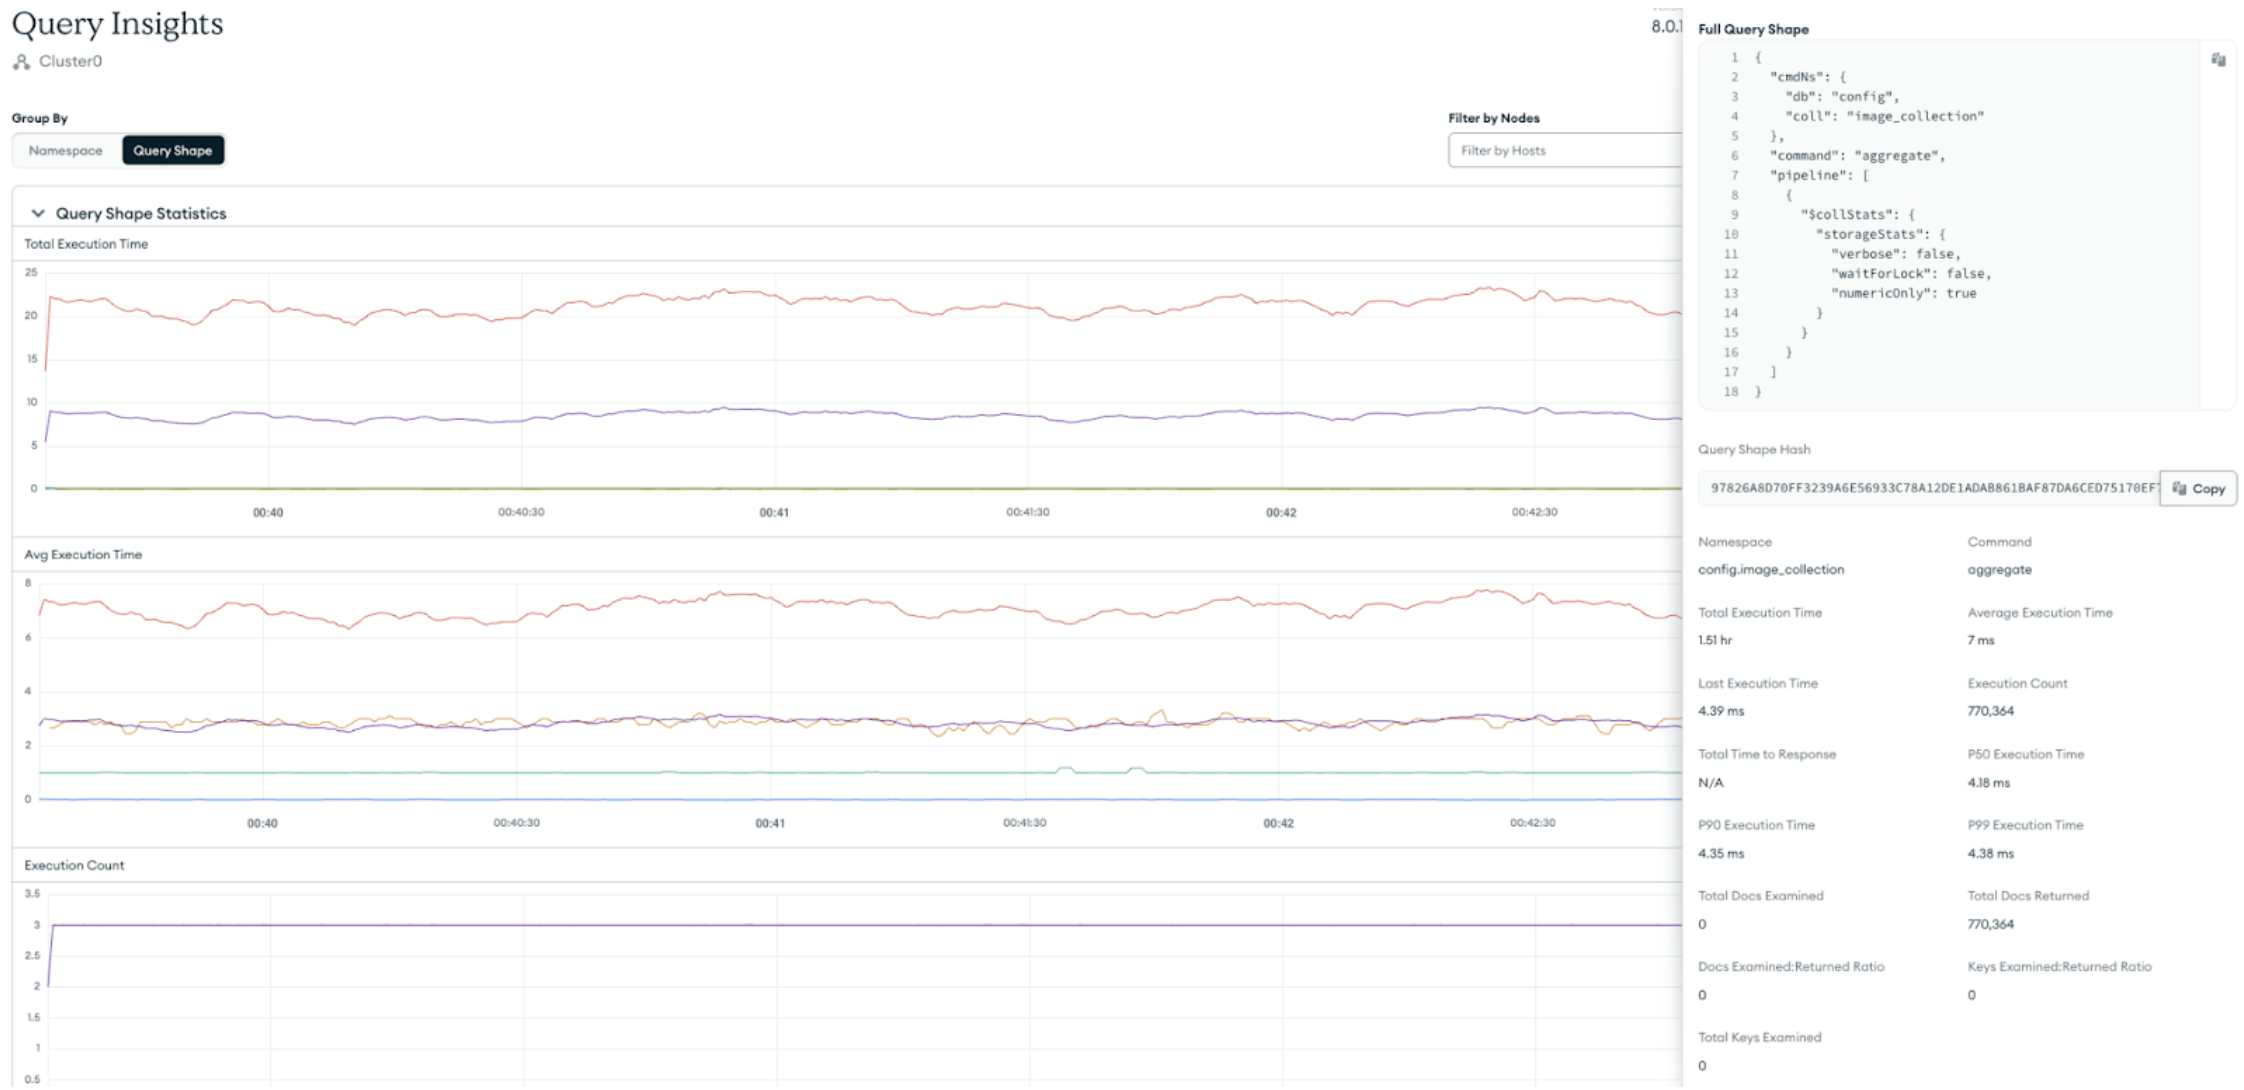
Detailed query shape statistics: Track key metrics including execution time, document return counts, and execution frequency.
-
Interactive analysis tools: Query shape drill-downs to view detailed metadata and performance trends.
-
Flexible filtering options: Narrow analysis by shard/host, data range, namespace, or operation type.
-
Programmatic access: Leverage MongoDB’s new Admin API endpoint to integrate query shape data with the existing observability stack.
After using Query Shape Insights, MongoDB Atlas users can pivot directly to Query Profiler with filters pre-applied to the specific collection and operation type for more information beyond that provided by Query Shape Insights. Once they have traced the issue to its root, users can continue their diagnostics journey by visiting Performance Advisor. This recommends indexes tailored to the query shape, ensuring that cluster optimizations are data-driven and precise.
Query Shape Insights is a leap forward in how teams manage, investigate, and respond to performance issues with MongoDB. By introducing a high-level, shape-aware view of query activity, Query Shape Insights enhances traditional reactive troubleshooting with greater clarity. This enables teams to troubleshoot faster and monitor performance effectively.
Query Shape Insights is now available for all MongoDB Atlas dedicated clusters (M10 and above) deployments. Clusters must run on MongoDB 8.0 or later to access this feature. Support for Cloud Manager deployments is planned for the future. Check out MongoDB’s documentation for more details on Query Shape Insights.
Start using Query Shape Insights today through your MongoDB Atlas portal.
This article first appeared on Read More