Best React chart libraries (2025 update): Features, performance & use cases
Here is a quick summary of the adoption and popularity of the React chart libraries we’ll discuss below:
| Library | Stars | Downloads | Rendering | Backed by |
|---|---|---|---|---|
| Recharts | 24.8k+ | 3.6m+ | SVG | Open source community |
| react-chartjs-2 | 6.8k+ | 1.6m+ | Canvas | Open source community |
| Victory | 11.1k | 272k+ | SVG | Formidable Labs |
| Nivo | 13.5k+ | 665k+ | SVG, Canvas, HTML | Open source community |
| React ApexCharts | 1.3k+ | 550k+ | SVG | Open source community |
| Ant Design Charts | 2k+ | 61k+ | Canvas | Ant Design Team |
| Apache ECharts | 62.2k+ | 1.1m+ | SVG, Canvas | Apache |
| visx | 19.9k+ | 2.2m+ | SVG | Airbnb |
| MUI X Charts | 4.7k | 349K+ | SVG | MUI team |
Editor’s note: This article was last updated by Carlos Mucuho in April 2025 to include emerging libraries such as React ApexCharts, Ant Design Charts, and MUI X Charts, share developer community insights on trending libraries, and address some common React chart library FAQs.
Why use React chart libraries?
Chart libraries are designed to ease the process of building charts and other data visualizations. When working on small projects, it’s often simple enough to create charts from scratch. However, if you’re working on a project that requires you to display data of different types, it can make more sense to use a chart library.
In today’s React ecosystem, there are many libraries designed to help you create interactive, responsive, and even animated charts. In the next sections, we’ll compare the top React chart libraries in 2025, evaluating them for criteria including features, documentation, community adoption, and customizability.
What developers are saying: Community insights on React Chart libraries
Developers on Reddit and X express diverse opinions on React chart libraries, reflecting varying project needs and preferences.
Which libraries do developers love/hate and why?
- Recharts — This library is consistently praised for its simplicity, ease of use, and clean SVG rendering. Its strong community support and integration with UI libraries like Mantine contribute to its popularity. Developers appreciate its straightforward API, making it easy to create common chart types. Key strengths include its simplicity, ease of use, clean SVG rendering, and strong community support
- Nivo — This library is gaining popularity for its versatility, supporting SVG, Canvas, and HTML rendering. Developers appreciate its ability to adapt to various project requirements. A key strength is its versatility and multiple rendering options
- Apache ECharts — Recognized for its comprehensive feature set and large community, but its complexity can be overwhelming for smaller projects. Key strengths include its feature-rich nature, large community, and rendering option variety, but it is noted to have complexity issues
- visx — Highly regarded for its flexibility and D3.js integration, but it is noted to have a steep learning curve
Which libraries are gaining or losing favor?
- Nivo — Appears to be gaining favor due to its versatility and support for multiple rendering methods
- Recharts — Maintains its strong position due to its simplicity and ease of use, remaining a popular choice
- visx — Is being discussed more, but the learning curve might slow down widespread adoption
The best React chart libraries in 2025
Recharts
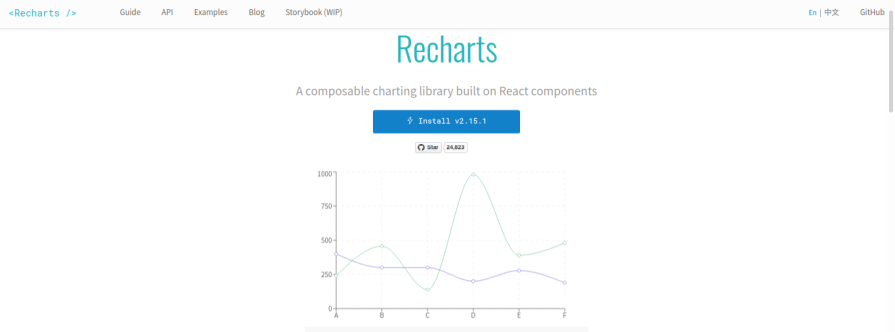
With over 24.8K stars on GitHub, Recharts is a redefined chart library built with D3 and React. One of the most popular charting libraries for React, Recharts has excellent documentation that is easy to understand, as well as great project maintainers.
Recharts follows React’s component principle by enabling users to build charts with its reusable React components. It provides beautiful charts out of the box that can be customized by tweaking the existing component’s props or adding custom ones.
Recharts has drawing support for SVGs only and does not provide support for mobile. The charts are not responsive by default, but can be made responsive by using the ResponsiveContainer wrapper component.
Recharts has been around for a while, so it has a large developer community. You can easily get started with this chart library by using its CDN or installing it with either npm or Yarn:
npm install recharts
OR
yarn add recharts
CDN:
<script src="https://unpkg.com/react/umd/react.production.min.js"></script>
<script src="https://unpkg.com/react-dom/umd/react-dom.production.min.js"></script>
<script src="https://unpkg.com/recharts/umd/Recharts.min.js"></script>
Recharts summary
- React component syntax
- Based on D3
- SVG support/No Canvas support
- GitHub stars: 24.8K+
- npm downloads: 3.6M+ weekly downloads
- Backed by the open source community
react-chartjs-2
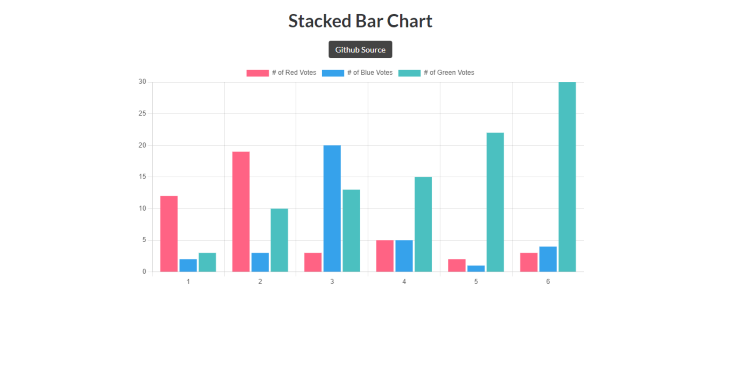
If you’ve used Chart.js in React, you should experience no learning curve when using react-chartjs-2. react-chartjs-2 is a React wrapper for the popular JavaScript Chart.js library. Many features of Chart.js can be used in react-chartjs-2.
react-chartjs-2 has drawing support for Canvas only and renders on the client-side. At the time of writing, it has more than 6.8K stars on GitHub.
react-chartjs-2 supports animation, and most of the charts it offers are responsive by default. The library provides some components for various types of chart styles out of the box and also allows for customization.
Although react-chartjs-2 does not have detailed documentation of its own, its website shows the different chart types and how to get started with them. Additionally, Chart.js has detailed, easy-to-understand documentation.
This library performs well across all modern browsers and also has a large community of users and great maintainers. It can be installed using npm or Yarn:
npm i react-chartjs-2 chart.js
OR
yarn add react-chartjs-2 chart.js
react-chartjs-2 summary
- React component syntax
- Based on Chart.js
- Canvas support/No SVG support
- GitHub stars: 6.8k
- npm downloads: 1.6M+ weekly downloads
- Backed by the open source community
Victory
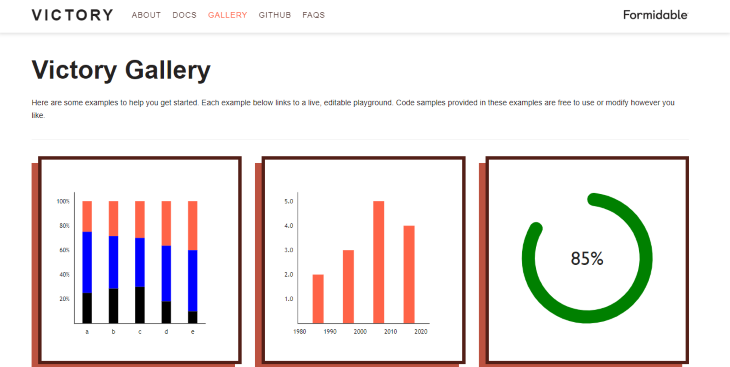
According to its official documentation, Victory is “an opinionated, but fully overridable, ecosystem of composable React components for building interactive data visualizations.”
Like many other React chart libraries on the list, Victory was built with React and D3. It comes with a wide variety of charts out of the box that are fully customizable.
Victory has robust, detailed documentation, which makes the library beginner-friendly and easy to get started with. It features drawing support for SVG and high-quality animations that can be customized (at least to some extent). Victory also offers responsive charts that work well across screen sizes, and it supports chart component animations.
The library has 11.1K stars on GitHub at the time of writing and is maintained by the developers at Nearform, formerly Formidable Labs.
A major advantage of using Victory is that it can also be used to build iOS and Android applications. This is because Victory has a version for React Native that uses an almost identical API to the web version.
Victory can be installed using npm or Yarn:
npm install victory
OR
yarn add victory
Victory summary
- React component syntax/Support for React Native
- Based on D3
- SVG support/No Canvas support
- GitHub stars: 11.1K
- npm downloads: 272K+ weekly download
- Backed by Formidable Labs
Nivo
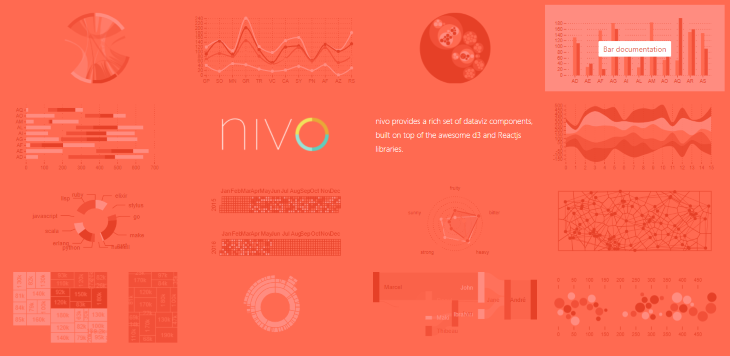
Nivo, like many other React chart libraries, was built with React and D3 and provides a variety of chart types and designs to choose from. The library offers HTML, Canvas, and SVG charts, provides support for client and server-side rendering, and works well with animations.
Nivo comes with a wide range of beautiful charts that can be customized if needed, without much difficulty. Many of the charts Nivo provides are responsive by default, so they fit well across various screen sizes. Nivo also supports motion and transitions, which are powered by React Motion.
At the time of writing, Nivo has 13.5K GitHub stars. It boasts a thriving community and engaged maintainers and has a beautiful website with detailed documentation that makes it easy to get started. Nivo can be installed using npm or Yarn:
npm install @nivo/core @nivo/bar --legacy-peer-deps
To use Nivo, install the @nivo/core package first, then select the appropriate scoped @nivo packages based on the charts you want to use. The command above installs the package required for using the bar chart. You have to use the --legacy-peer-deps flag to force the installation while ignoring peer dependency conflicts. At the moment, Nivo does not yet support the latest React version.
Nivo summary
- React component syntax
- Based on D3
- SVG, Canvas, and HTML support
- Animations powered by React Motion
- GitHub stars: 13.5K
- npm downloads: 665K+
- Backed by Open Source Community
React ApexCharts
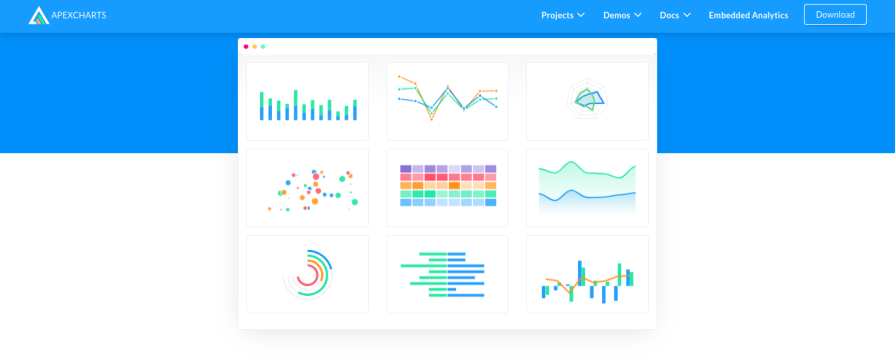
React ApexCharts is a React wrapper for ApexCharts, a modern JavaScript charting library that helps developers create interactive visualizations for web pages. With over 1.3K stars on GitHub, it has become increasingly popular among React developers who need sophisticated charting capabilities.
React ApexCharts offers a wide range of chart types, including line, area, bar, pie, donut, scatter, bubble, heatmap, and radial bar charts. One of its standout features is the ability to create mixed charts that combine different chart types within a single visualization.
The library provides robust interactive features such as zooming, panning, and scrolling with excellent animation support. All charts are responsive by default, making them ideal for projects that need to work across various devices and screen sizes. React ApexCharts also offers support for real-time data updates, which is particularly useful for dashboards and monitoring applications.
React ApexCharts renders using SVG, which allows for better quality graphics that scale well. The library also provides extensive customization options through a comprehensive API, allowing developers to modify everything from colors and fonts to tooltips and legends.
Documentation for React ApexCharts is well-structured and includes numerous examples, making it easy for developers to get started. The library is actively maintained, with regular updates and improvements.
You can install React ApexCharts using npm:
npm install react-apexcharts apexcharts
React ApexCharts summary
- React component syntax
- Based on ApexCharts.js
- SVG support/No Canvas support
- GitHub stars: 1.3K+
- npm downloads: 550K+ weekly downloads
- Backed by the open source community
Ant Design Charts
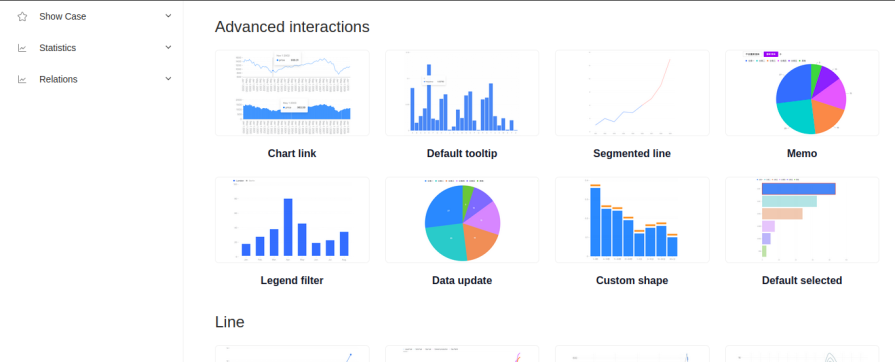
Ant Design Charts is a charting library developed by the team behind the popular Ant Design UI framework. It integrates seamlessly with other Ant Design components, making it an excellent choice for developers already using the Ant Design ecosystem.
The library offers a comprehensive range of chart types, including conventional options like line, bar, and pie charts and more specialized visualizations such as funnel charts, radar charts, and gauge charts. Ant Design Charts also provides support for statistical charts like box plots and waterfall charts.
One of the key advantages of Ant Design Charts is its focus on user experience and accessibility. The charts come with built-in features like tooltips, legends, and responsive layouts that adapt to different screen sizes. The library also provides robust theming capabilities, allowing developers to customize the look and feel of charts to match their application’s design.
Ant Design Charts handles large datasets efficiently through Canvas rendering, which results in better performance compared to SVG-based alternatives when dealing with complex visualizations.
The documentation for Ant Design Charts is comprehensive, though some sections may only be available in Chinese. However, the code examples are clear enough that most developers can understand how to implement the charts even with limited documentation in English.
Ant Design Charts can be installed using npm or Yarn:
npm install @ant-design/charts
OR
yarn add @ant-design/charts
Ant Design Charts summary
- React component syntax
- Canvas support
- GitHub stars: 2K+
- npm downloads: 61K+ weekly downloads
- Backed by Ant Design Team
Apache ECharts
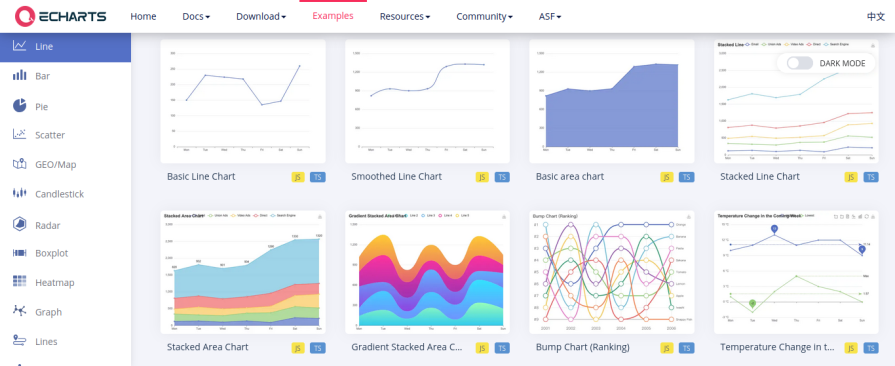
Apache ECharts is a charting library built by Apache. Having been built on top of ZRender, a lightweight Canvas library, it provides both SVG and Canvas support.
Besides the usual chart types, ECharts also provides a few unique chart types like Sankey diagrams, graphs, and heatmaps. Along with multiple data visualization types, ECharts also provides a wide range of customization options and has support for themes and extensions. It also supports animation and is responsive by default.
Many of the charts in ECharts are optimized for mobile interaction, like zooming and panning the coordinate system with your fingers on small screens.
Its extensive customization options and support for themes and extensions make ECharts a great choice for developers who want to create beautiful, informative charts with detailed data visualizations.
ECharts can be installed using npm or Yarn:
npm install echarts
OR
yarn add echarts
Apache ECharts summary
- Vanilla JavaScript syntax
- Top notch animations and aesthetics
- Themes and extensions — also supports light and dark themes
- SVG and Canvas support
- GitHub stars: 62.2K+
- npm downloads: 1.1M+ weekly downloads
- Backed by Apache
visx
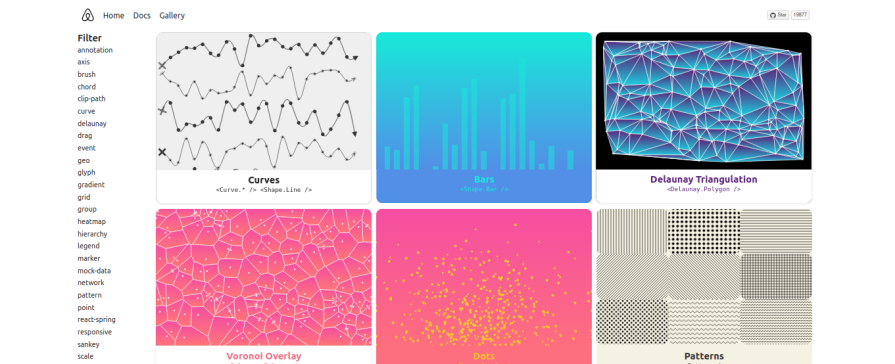
visx is a collection of reusable data visualization components built by Airbnb. It is built on top of D3 and provides a wide range of chart types and supports both SVG and Canvas.
Its minimalistic design makes visx aesthetically pleasing. The API is also super customizable and allows you to build your own charting library on top of it.
visx also has a strong focus on performance and keeps bundle sizes small. It works well with CSS-in-JS libraries like styled-components and Emotion.
visx can be installed using npm:
npm i @visx/group @visx/shape @visx/scale --legacy-peer-deps
Since visx is a collection of components, you will need to select the appropriate @visx packages based on the charts you want to create. At the moment, some of the @visx packages do not yet support the latest React version. You have to use the --legacy-peer-deps flag to force the installation while ignoring peer dependency conflicts.
visx summary
- React component syntax
- Based on D3
- SVG support/No Canvas support
- GitHub stars: 19.9K+
- npm downloads: 2.2M+ weekly downloads (@visx/shape)
- Backed by Airbnb
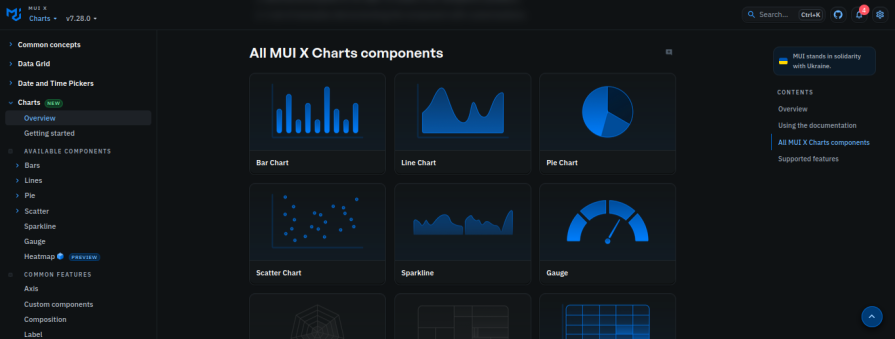
MUI X Charts
MUI X Charts is a charting library built by the Material UI (MUI) team, designed to seamlessly integrate with the popular React UI framework. It leverages the power of the MUI ecosystem, providing a cohesive and aesthetically pleasing charting experience.
MUI X Charts offers a variety of chart types, including line, bar, scatter, and pie charts, with a strong emphasis on customization and accessibility. It utilizes SVG rendering for efficient performance.
One of the key advantages of MUI X Charts is its tight integration with the MUI theme and styling system. This allows developers to easily customize the look and feel of their charts to match their application’s design. The library also provides comprehensive documentation and numerous examples, making it easy to get started.
MUI X Charts is actively maintained by the MUI team, ensuring regular updates and improvements. It benefits from the strong community and support of the broader MUI ecosystem.
MUI X Charts can be installed using npm or Yarn:
npm install @mui/x-charts
or
yarn add @mui/x-charts
The Charts package has a peer dependency on @mui/material. If you are not already using it in your project, you can install it with:
npm install @mui/material @emotion/react @emotion/styled
or
yarn add @mui/material @emotion/react @emotion/styled
Mui X Charts summary
- React component syntax
- SVG support
- Seamless MUI integration
- GitHub stars: 4.7K
- npm downloads: 349K+ weekly downloads
- Backed by MUI team
Frequently asked questions about React chart libraries
What is the best React chart library for large datasets?
For large datasets, Canvas or WebGL rendering typically outperforms SVG. Apache ECharts handles tens of thousands of data points efficiently. React-chartjs-2 offers a good balance between usability and performance.
Regardless of library choice, implementing data aggregation or windowing techniques can significantly improve chart responsiveness.
How do I choose the right React chart library?
Consider your project’s specific needs:
- Project complexity — Simpler charts might only need Recharts, while complex visualizations may require Visx or ECharts
- Team expertise — Recharts and react-chartjs-2 have gentler learning curves than Visx
- Performance requirements — For data-heavy applications, consider Canvas-based libraries
- Customization needs — Victory and Visx offer extensive customization, but demand more development effort
- Bundle size impact — Compare sizes for performance-critical applications
Which React chart library is best for real-time data?
react-chartjs-2 and React ApexCharts handle streaming data well, while Apache ECharts offers specialized components for dynamic data. For optimal performance with real-time visualization, implement throttling/debouncing, use windowing techniques, choose libraries with efficient update methods, and consider Canvas over SVG for higher update frequencies.
Common pain points when using charting libraries and how to deal with them
Visualizing large datasets can be quite challenging, leading to slow performance and high memory usage, which may even crash the browser. Also, unnecessary rerendering often occurs with state management libraries like Redux, Redux Toolkit, etc., while handling asynchronous updates. Ensuring the responsiveness of chart components on mobile is another common challenge.
This section will address these pain points:
Visualizing large datasets
Performance can be improved by throttling and debouncing the data streams to reduce the rate at which the chart is rerendered. Another way to improve performance is by integrating chart libraries that leverage WebGL or Canvas.
Unnecessary re-rendering with Redux
You can avoid unnecessary re-renders by using the useMemo or useCallback React Hooks to memoize chart data so that the chart component only updates when necessary. Complex data transformation logic can also lead to redundant re-renders when it’s handled in the store. Ensure that it’s handled in a selector or, better still, the component rendering the chart.
Mobile responsiveness
Most of these chart libraries rely on D3.js for the fine-tuning of touch gestures on mobile screens. Some also provide responsive classes or props for mobile responsiveness. Chart libraries like Recharts and react-chartjs-2 allow you to specify dynamic dimensions that fit into the parent container in a fluid manner.
Conclusion
There are more charting libraries available for React than we can cover in a single article, but the few libraries described above are among the most widely adopted and beloved in the React community.
When deciding on a chart library to use for your React project, remember that they were all created to help developers achieve a particular end result. Compare their functions and what they offer before deciding which is best for your project. Some chart libraries might be ideal for smaller projects, while others are better suited to more complex projects.
Ultimately, the choice of what React chart library to use depends on your project requirements and what types of features you prefer to work with.
The post Best React chart libraries (2025 update): Features, performance & use cases appeared first on LogRocket Blog.
This post first appeared on Read More


