A practical walkthrough of Java compilation, class loading, runtime memory, and execution flow from a developer’s perspective.
As Java developers, we often spend most of our time writing business logic, building APIs, fixing bugs, integrating databases, and deploying applications. We use commands like javac, java, or java -jar app.jar, and most of the time, the application starts and runs as expected.
But at some point in our development journey, especially when working on real-world backend applications, one question becomes important:
What actually happens behind the scenes when a Java application runs?
This question is not only useful for interviews. It is useful when we debug startup issues, classpath problems, memory errors, slow application performance, garbage collection behavior, or production failures.
I started revisiting this topic because I wanted to understand Java beyond syntax and frameworks. Java is not just about writing classes, interfaces, annotations, or Spring Boot controllers. Behind every Java application, there is a runtime system that loads classes, verifies bytecode, manages memory, executes instructions, optimizes frequently used code, and cleans up unused objects.
In this article, I will walk through the journey of a Java program from source code to runtime execution, covering JDK, JRE, JVM, class loading, linking, initialization, runtime memory areas, the execution engine, and why all of this matters for real Java development.
The Question: What Happens When We Run java -jar app.jar?
When we run:
java -jar app.jar
It looks like a single command. But internally, multiple things happen:
Operating System starts a JVM process
        ↓
JVM prepares required runtime structures
        ↓
Initial classes are loaded
        ↓
Bytecode is verified
        ↓
Classes are linked
        ↓
Classes are initialized
        ↓
main() method is located and invoked
        ↓
Application execution begins
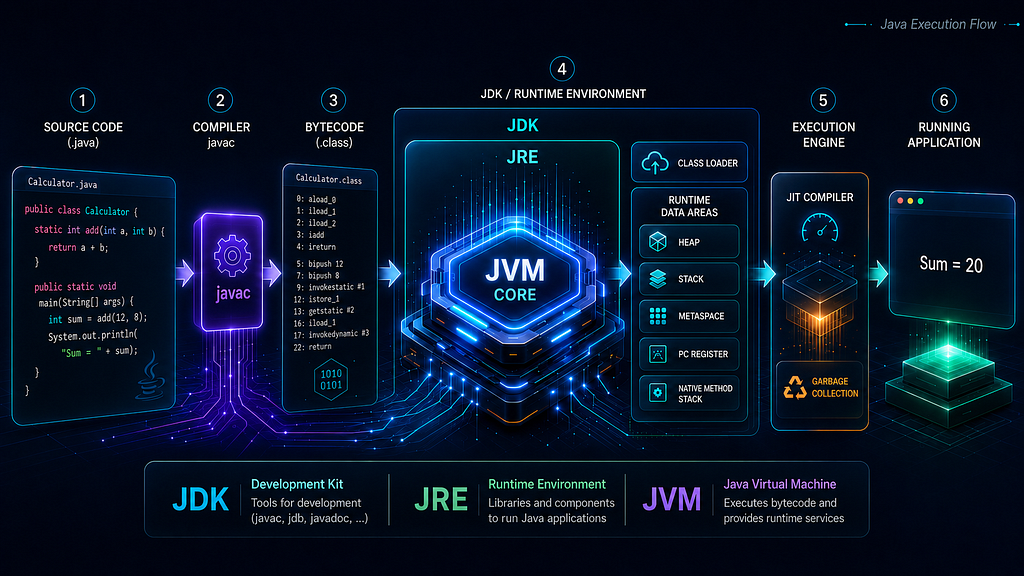
This flow is the foundation of Java execution. Before going deeper into JVM internals, we need a clear understanding of three commonly used terms: JDK, JRE, and JVM.
JDK, JRE, and JVM: More Than Basic Definitions
Most Java developers learn this early:
JDK = Java Development Kit
JRE = Java Runtime Environment
JVM = Java Virtual Machine
But for practical understanding, this definition is not enough. A better way to think about them is:
JDK -> Used to develop Java applications
JRE -> Runtime environment concept required to run Java applications
JVM -> Engine/specification responsible for executing bytecode
Let us break this down carefully.
JDK: The Developer’s Toolkit
The Java Development Kit, or JDK, is what we use as developers to build Java applications.
It includes development tools such as:
javac     -> Java compiler
java      -> Java application launcher
jar       -> Packaging tool
javadoc   -> Documentation generator
jdb       -> Debugging tool
The most important tool for our current discussion is javac. When we write a Java file like this:
public class OrderProcessor {
   public static void main(String[] args) {
      Order order = new Order(101, 2499.50);
      double finalAmount = order.calculateFinalAmount(10);
      System.out.println("Final amount: " + finalAmount);
   }
}

class Order {
    private final int orderId;
    private final double amount;

    Order(int orderId, double amount) {
        this.orderId = orderId;
        this.amount = amount;
    }

    double calculateFinalAmount(double discountPercentage) {
        double discount = amount * discountPercentage / 100;
        return amount - discount;
    }
 }
Here, the file name must match the public class name, so the file is saved as OrderProcessor.java
The JVM does not directly execute this .java file. First, the Java compiler compiles it:
javac OrderProcessor.java
This produces:
OrderProcessor.class
Order.class
The reason two .class files are generated is that the source file contains two classes: OrderProcessor and Order. The OrderProcessor class contains the main() method, while the Order class represents a simple domain object with fields, a constructor, and a method for calculating the final amount after discount. Now, the .class file contains bytecode.
Bytecode is not machine code for Windows, Linux, or macOS. It is an intermediate instruction format designed for the JVM. The JVM reads this bytecode and executes it, using its runtime components.
This small example gives us a more realistic view of Java execution. The main() method starts the program, the new Order(…) statement creates an object, the constructor initializes its fields, and the calculateFinalAmount() method is invoked during execution.
So, as developers, we use the JDK to write, compile, package, run, debug, and monitor Java applications.
JRE: The Runtime Side of Java
The Java Runtime Environment, or JRE, represents the runtime components needed to run Java applications.
Conceptually, the JRE contains:
JVM
Core Java class libraries
Runtime support files
Traditionally, we used to say:
JDK = JRE + Development Tools
JRE = JVM + Libraries
This is still a useful mental model, especially for understanding older Java distributions and basic Java architecture.
However, we should be careful with modern Java versions. From JDK 11 onward, Oracle no longer provides a separate standalone JRE download in the same way it did earlier. In modern deployments, we often install a JDK or create a custom runtime image using tools such as jlink.
So, in a technically safer way:
JRE is the runtime environment concept, while the JDK is the full development kit that includes the tools and runtime support needed for development and execution.
This distinction matters because a beginner-friendly explanation may say “JDK includes JRE,” but modern Java packaging is more modular than that.
JVM Architecture
The Java Virtual Machine, or JVM, is responsible for executing Java bytecode.
From .java to .class: Why Bytecode Matters
The Java execution journey starts with source code.
OrderProcessor.java
        ↓
javac
        ↓
OrderProcessor.class
The .class file contains JVM bytecode.
This bytecode is platform-independent in the sense that it is not compiled directly for a specific operating system or processor architecture. Instead, each platform provides a compatible JVM implementation.
So the execution model becomes:
Java Source Code
        ↓
Java Compiler
        ↓
Bytecode
        ↓
Platform-specific JVM
        ↓
Native execution on the machine
This is the foundation behind Java’s famous idea:
Write Once, Run Anywhere
In practical systems, platform independence also depends on external factors such as file paths, native libraries, OS-specific configurations, environment variables, and deployment setup. But at the bytecode level, Java achieves portability through the JVM.
Before main() Runs: JVM Startup Flow
Many developers think the program starts directly from the main() method. But before main() runs, the JVM has already done a lot of work.
When we run:
java OrderProcessor
or:
java -jar app.jar
The operating system starts a Java process. The Java launcher starts the JVM, and the JVM begins preparing the application for execution.
A simplified startup flow looks like this:
1. JVM process starts
2. Required runtime areas are prepared
3. Initial classes are loaded
4. Bytecode verification happens
5. Classes are linked
6. Classes are initialized
7. main() method is found and invoked
8. Application starts executing
The exact internal details may vary based on JVM implementation, Java version, launch mode, classpath, module path, and runtime configuration. But this flow gives us a reliable mental model.
Now let us go deeper into one of the most important parts: class loading.
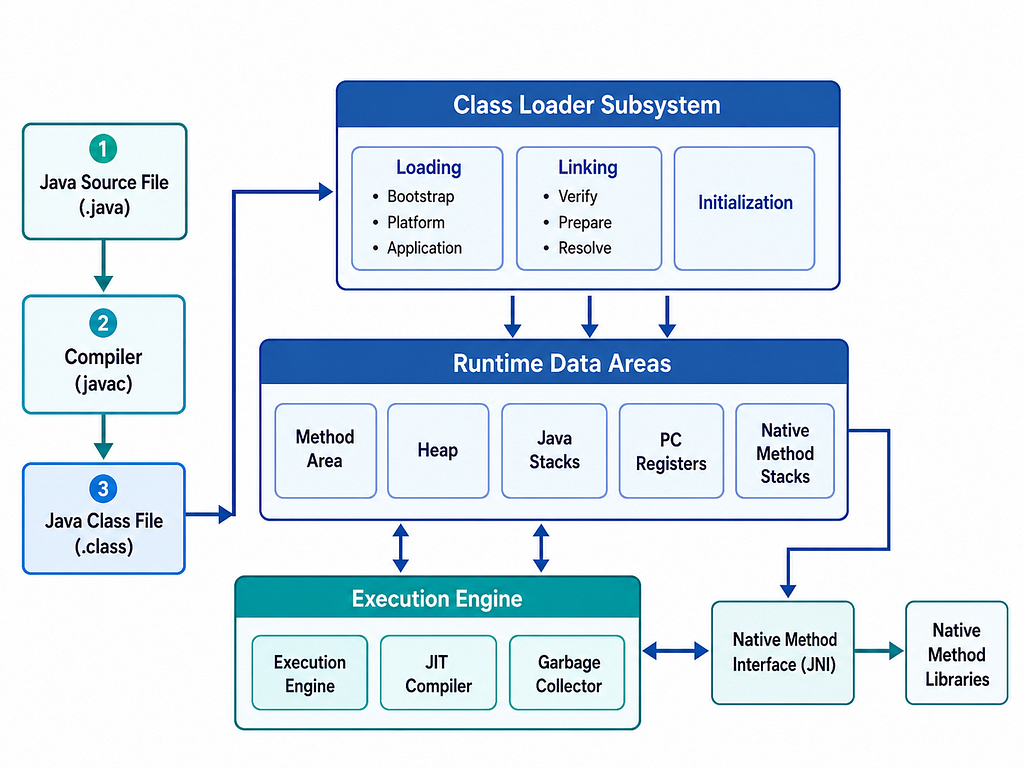
Class Loading: Loading Classes When They Are Needed
Java does not load every class in an application at once. Classes are typically loaded when they are first needed. The JVM uses the ClassLoader subsystem to locate and load class definitions. In modern Java, commonly discussed class loaders are:
Bootstrap ClassLoader
Platform ClassLoader
Application ClassLoader
Bootstrap ClassLoader
The Bootstrap ClassLoader loads core Java classes. For example:
java.lang.String
java.lang.Object
java.lang.Class
These are fundamental classes required by the Java runtime itself.
Platform ClassLoader
The Platform ClassLoader loads platform-level classes and modules. This class loader became especially relevant after the Java Platform Module System was introduced in Java 9.
Application ClassLoader
The Application ClassLoader, also called the System ClassLoader, loads application classes from the classpath or module path. For example, it loads our application classes and dependencies. In a backend application, this can include:
Your service classes
Spring Boot classes
Third-party library classes
Database driver classes
Utility classes
Parent Delegation Model
Class loading usually follows the parent delegation model.
The basic idea is:
A class loader first delegates the request to its parent.
If the parent cannot load the class, the child class loader tries to load it.
A simplified flow:
Application ClassLoader
        ↓ delegates to
Platform ClassLoader
        ↓ delegates to
Bootstrap ClassLoader
If the Bootstrap ClassLoader cannot load the class, the request comes back down the chain. This model improves consistency and security. It helps prevent application code from accidentally replacing core Java classes. For example, an application should not be able to replace java.lang.String with its own custom version.
In real development, class loading knowledge becomes useful when we face errors such as:
ClassNotFoundException
NoClassDefFoundError
ClassCastException
Dependency conflicts
Classpath issues
These issues are common in enterprise applications, modular systems, application servers, plugin architectures, and sometimes even in complex Spring Boot applications.
Loading, Linking, and Initialization
After a class is found, the JVM does not simply execute it immediately.
The lifecycle of a class involves three major phases:
Loading
Linking
Initialization
This is one of the most important sections in JVM understanding.
1. Loading
During loading, the JVM finds the binary representation of a class or interface and creates the internal representation of that class inside the JVM.
In simple terms:
.class file is found
        ↓
Class data is read
        ↓
Class representation is created inside JVM
The class can come from different sources:
File system
JAR file
Network
Generated bytecode
Custom ClassLoader
This is why Java supports advanced use cases such as dynamic class loading, application servers, plugin systems, and frameworks that generate classes at runtime.
2. Linking
After loading, the class is linked. Linking prepares the class so the JVM can use it.
Linking has three main parts:
Verification
Preparation
Resolution
Verification
Verification checks whether the bytecode is valid and safe. The JVM verifies that the class file follows JVM rules.
For example, it checks things like:
Is the bytecode structurally valid?
Are operand stack operations correct?
Are type rules followed?
Is there any illegal access pattern?
This verification step is important because Java bytecode may come from different sources. The JVM must ensure that the bytecode is safe before executing it.
Preparation
During preparation, memory is allocated for class-level static variables, and default values are assigned.
For example:
class Counter {
    static int count = 10;
}
During preparation, count receives its default value:
0
The actual value 10 is assigned later during initialization. This is a small but important detail. Preparation does not execute Java code. It only prepares memory for class variables and assigns default values.
Resolution
During resolution, symbolic references are converted into direct references. For example, bytecode may contain symbolic references to classes, fields, or methods. The JVM resolves these references so they can be used during execution.
One important nuance: resolution may happen during linking or later, depending on the JVM implementation. So it is safer to understand resolution as part of the linking process, but not always assume that every reference is resolved immediately at class load time.
3. Initialization
Initialization is the phase where class initialization logic runs. This includes:
Assigning actual values to static fields
Executing static blocks
Example:
class AppConfig {
    static int port = 8080;
static {
        System.out.println("AppConfig initialized");
    }
}
During preparation, memory is allocated for the static variable and it gets the default value:
port = 0
During initialization, the actual assignment and static block execution happen:
port = 8080
static block executes
Initialization usually happens before the first active use of a class. Also, class initialization happens at most once per class per class loader.
This “per class loader” part is important. In simple applications, we may not notice it. But in application servers, plugin systems, or custom class loading environments, the same class name loaded by different class loaders can behave like different classes.
JVM Runtime Data Areas
Once classes are loaded, linked, and initialized, the JVM needs memory areas to manage execution.
The JVM specification defines several runtime data areas:
PC Register
JVM Stack
Heap
Method Area
Runtime Constant Pool
Native Method Stack
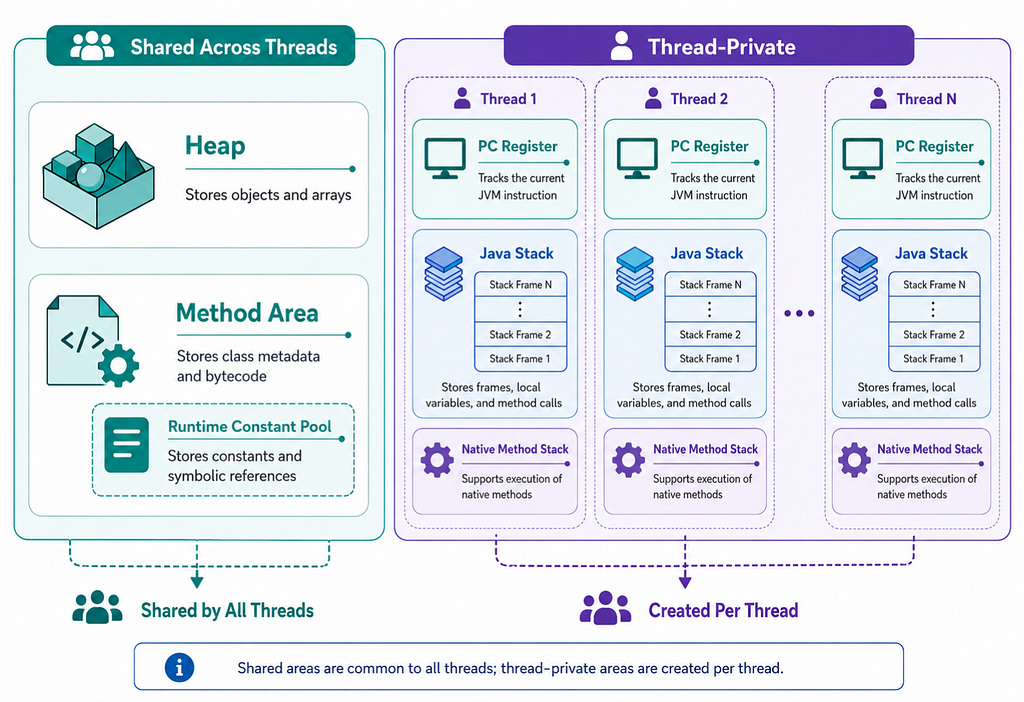
The heap is a shared runtime memory area. Objects and arrays are allocated on the heap.
Example:
Customer customer = new Customer("John");Here, the Customer object is allocated on the heap. The reference variable customer may live inside a stack frame, but the object itself lives on the heap.
The heap is shared among JVM threads, which means multiple threads can access objects on the heap if they have references to them. This is why object lifecycle and memory management are important in Java applications.
The JVM manages heap memory using Garbage Collection.
When an object is no longer reachable, it becomes eligible for garbage collection. It does not mean the object is immediately removed. It means the Garbage Collector may reclaim its memory when it runs.
In many HotSpot JVM configurations, heap management is generational. We often hear terms like:
Young Generation
Old Generation
Eden Space
Survivor Spaces
But this is not a universal rule of the JVM specification. It depends on the JVM implementation and the selected garbage collector. For example, different garbage collectors may organize heap memory differently.
So a careful statement is:
The JVM specification defines the heap as the area where objects and arrays are allocated. Generational heap layout is a common implementation strategy, especially in HotSpot, but not a universal JVM rule.
This distinction is important when writing publicly about JVM internals.
JVM Stack: Method Calls and Stack Frames
Each JVM thread has its own JVM stack. When a method is called, a new stack frame is created. A stack frame contains data needed for method execution, such as:
Local variables
Operand stack
Return information
Reference to runtime constant pool of the current method’s class
Example:
public int add(int a, int b) {
    int sum = a + b;
    return sum;
}
When add() is invoked, a stack frame is created for that method call. Inside that frame, the method parameters and local variables are managed. When the method completes, the stack frame is removed.
A simple flow:
Method is called
        ↓
Stack frame is created
        ↓
Method executes
        ↓
Method returns
        ↓
Stack frame is removed
This makes stack memory very structured and efficient. It also explains why local variables do not live beyond the method call. However, if a local variable holds a reference to an object, the reference may be in the stack frame, but the object itself is on the heap.
Example:
public void process() {
    Customer customer = new Customer("John");
}
Here:
customer reference -> stack frame
Customer object    -> heap
Once the method completes, the stack frame is removed. If no other live reference points to the Customer object, that object becomes eligible for garbage collection.
This also explains StackOverflowError. A common reason for StackOverflowError is uncontrolled recursion:
public void call() {
    call();
}
Each call creates a new stack frame. If the calls never complete, the stack keeps growing until the JVM cannot allocate more stack frames.
Method Area and Metaspace
The JVM specification defines a runtime area called the Method Area. The Method Area stores per-class structures such as:
Class metadata
Method information
Field information
Runtime constant pool
Code for methods and constructors
In HotSpot JVM, the implementation of this area changed over time. Before Java 8, HotSpot used Permanent Generation, commonly called PermGen, for class metadata. From Java 8 onward, HotSpot replaced PermGen with Metaspace.
A careful way to say this is:
Metaspace is a HotSpot JVM implementation detail used for class metadata storage from Java 8 onward. It is not the same thing as saying every JVM specification has Metaspace.
Metaspace uses native memory rather than Java heap memory. It can be controlled using options such as:
-XX:MetaspaceSize
-XX:MaxMetaspaceSize
This topic matters in large applications and frameworks because modern Java applications often load many classes. For example, Spring-based applications may involve:
Reflection
Dynamic proxies
Configuration classes
Generated classes
Framework-level metadata
Third-party dependencies
If class loading is excessive, or if class loaders are not released properly in long-running systems, Metaspace-related memory issues can occur.
PC Register: Current JVM Instruction Per Thread
Each JVM thread has its own PC register. The PC register holds the address of the current JVM instruction being executed by that thread. If the thread is executing a native method, the value of the PC register is undefined.
This is a detail that is easy to explain incorrectly. It is better not to say that the PC register stores the “physical memory address of the current statement.” Java bytecode execution is more abstract than that.
A safer explanation is:
The PC register tracks the current JVM instruction for a thread.
Native Method Stack and JNI
Java can interact with native code using the Java Native Interface, commonly known as JNI. Native methods are methods written in languages such as C or C++ and called from Java.
The Native Method Stack is used to support native method execution, depending on the JVM implementation. Most Java developers may not work directly with JNI every day, but native interaction appears in many areas, such as:
Database drivers
Compression libraries
Cryptography
Operating system integration
High-performance libraries
Monitoring agents
So even though JNI is not part of daily application code for many backend developers, it is part of the larger JVM execution ecosystem.
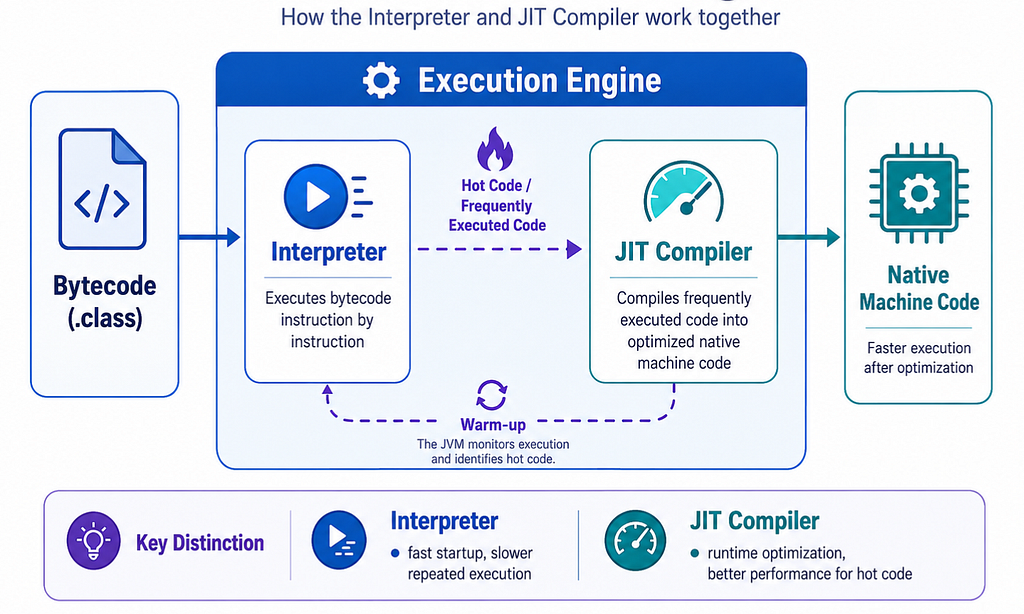
Execution Engine: Interpreter and JIT Compiler
After classes are loaded, linked, initialized, and runtime memory areas are ready, the JVM needs to execute bytecode.
This is handled by the execution engine. A simplified view:
Bytecode
   ↓
Interpreter
   ↓
JIT Compiler for frequently executed code
   ↓
Native machine code
The interpreter reads bytecode instructions and executes them. This allows Java applications to start running without waiting for everything to be compiled into native code first. However, interpreting bytecode instruction by instruction can be slower for frequently executed code.
This is where the JIT compiler helps. JIT stands for Just-In-Time.
The JIT compiler identifies frequently executed code paths and compiles them into optimized native machine code at runtime. So Java execution is not simply interpreted and not simply compiled ahead of time.
It is a combination:
Interpreter starts execution
        ↓
JVM observes runtime behavior
        ↓
Frequently executed code becomes hot
        ↓
JIT compiles hot code into optimized native code
        ↓
Performance improves during runtime
This is why Java applications can have a warm-up phase. A backend service may not reach its steady-state performance immediately after startup. The JVM may need time to collect profiling information and optimize important code paths. This matters during performance testing. Testing only the first few seconds after startup may not represent how the application behaves after warm-up.
Garbage Collection in Context
Garbage Collection is a large topic by itself, but it fits naturally into JVM execution because objects are allocated on the heap. The JVM automatically reclaims memory from objects that are no longer reachable.
This helps developers avoid manual memory management. But automatic memory management does not mean memory leaks are impossible.
Java applications can still leak memory when unused objects remain reachable.
Common examples include:
Static collections that keep growing
Caches without eviction policies
Listeners not removed
ThreadLocal values not cleared
Unclosed resources
ClassLoader leaks
When memory usage keeps increasing in a production application, understanding heap, references, and garbage collection helps us investigate the problem more effectively.
JVM Shutdown
A JVM process can stop in different ways. Common cases include:
main() method completes
System.exit() is called
A fatal error occurs
The process is killed externally
Before shutdown, the JVM may run registered shutdown hooks. Shutdown hooks are useful for cleanup work such as:
Closing resources
Stopping background threads
Flushing logs
Releasing connections
Completing graceful shutdown steps
In backend systems, graceful shutdown matters a lot. For example, a service should avoid stopping suddenly while it is processing requests, writing data, or holding external resources.
This is why modern application frameworks often provide graceful shutdown support.
A Practical Mental Model
Here is the full flow in one place:
Developer writes Java source code
        ↓
JDK tools compile source code using javac
        ↓
.class files containing bytecode are generated
        ↓
Java launcher starts JVM process
        ↓
JVM loads required classes
        ↓
Classes are verified, prepared, and resolved
        ↓
Static fields and static blocks are initialized
        ↓
main() method is invoked
        ↓
Objects are allocated on heap
        ↓
Methods execute using stack frames
        ↓
Interpreter executes bytecode
        ↓
JIT compiler optimizes hot code
        ↓
Garbage Collector reclaims unreachable objects
        ↓
Application continues until JVM shuts down
This flow gives us a strong foundation for understanding how Java works behind the scenes.
Final Thoughts
Java is more than syntax, frameworks, and APIs. Behind every Java application, there is a runtime system that performs many important operations before and during execution.
The JDK helps us develop and compile applications. The runtime environment provides what is needed to run them.
The JVM loads classes, verifies bytecode, links and initializes classes, manages runtime memory areas, executes bytecode, optimizes hot code, and supports garbage collection.
For me, understanding the JVM is part of becoming a better Java developer. It helps me move from simply writing Java code to understanding how that code behaves when the application actually runs.
The more we understand what happens behind the scenes, the better we become at debugging, optimizing, and building reliable Java applications.
![]()
Inside Java’s Runtime: How the JVM Brings Code to Life was originally published in Javarevisited on Medium, where people are continuing the conversation by highlighting and responding to this story.
This post first appeared on Read More