
Debugging with Chrome DevTools MCP: Giving AI eyes in the browser
I’ve been a web developer for a long time, and I’ve seen my share of debugging tools. But nothing has excited me as much as the Chrome DevTools MCP. For a long time, AI coding assistants have been coding blind with no way for them to see the results of their work.
Chrome DevTools MCP gives eyes to AI coding agents. It connects your AI coding agent directly to the browser, allowing it to see, diagnose, and verify its own work.
In this guide, I’m not just going to show you how to use it; I’m going to show you why it’s become my go-to debugging partner.
You’ll learn how to:
- Set up and configure the Chrome DevTools MCP client
- Diagnose console errors with AI assistance
- Simulate user behavior
- Debug styling and layout issues
Prerequisites
Before we start, make sure you have the following:
- A basic understanding of web development and debugging concepts
- An AI coding assistant that supports MCP (I’m using the Gemini CLI)
- Chrome browser is installed on your development machine
- Node.js v20.19 or a newer, latest maintenance LTS version
- Familiarity with Chrome DevTools (helpful but not required)
Let’s get into it.
What is the Chrome DevTools MCP server?
The Chrome DevTools MCP server is an MCP server designed by Google that provides AI agents access to Chrome DevTools directly inside your favorite code editor.
Chrome DevTools MCP enables AI agents to perform tasks such as:
- Inspecting the DOM and CSS
- Performance traces
- Executing JavaScript
- Reading console output
This tool provides power to AI coding agents, which we will explore further as we progress through the article.
It comes with the following tools for use:
clickupload_filelistnetworkrequestslist-console_messagestake_snapshot- …and many more
We will not cover all the tools in this article, as it is practice-based, but you can be sure that you will learn how these tools help in your workflow and how to apply them to your workflow as a developer.
How to set up Chrome DevTools MCP
I will be using Gemini CLI to interact with Chrome DevTools. Let’s set it up.
First, in your terminal, run the command below:
cd ~
This will lead you to the home folder. Then run the following command:
cd .gemini
This will open the Gemini folder. Next run:
ls
The above command will list all the files and folders in the .gemini folder.
Our file of interest is the settings.json.
Run the following command to open it in VS Code:
code settings.json
When the file is opened in VS Code, add the following to the file and save:
  "mcpServers": {
    "chrome-devtools": {
      "command": "npx",
      "args": ["-y", "chrome-devtools-mcp@latest"]
    }
  }
The file should now look like this: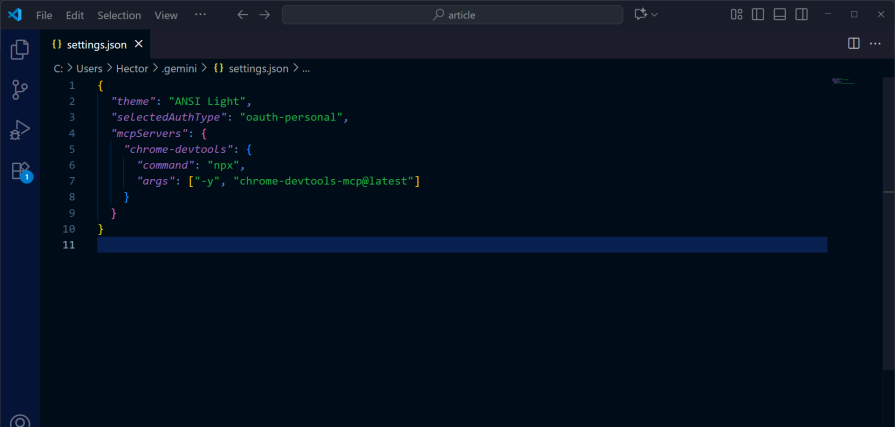
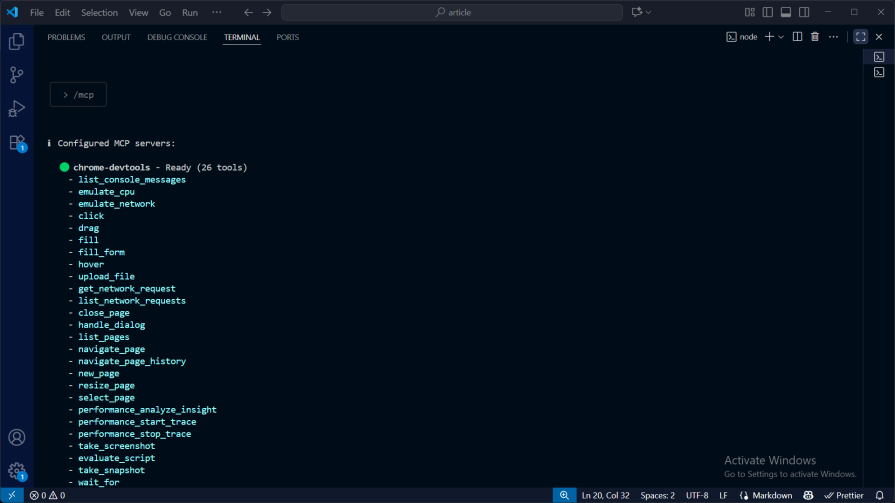
To verify if you correctly set up the MCP server in Gemini CLI, run /mcp. You should see a similar screen to this:
Let’s conduct a test to verify that we can communicate with the server.
To test it, try this prompt with your AI: “Check out the state of this app in http://localhost:5173 ”:
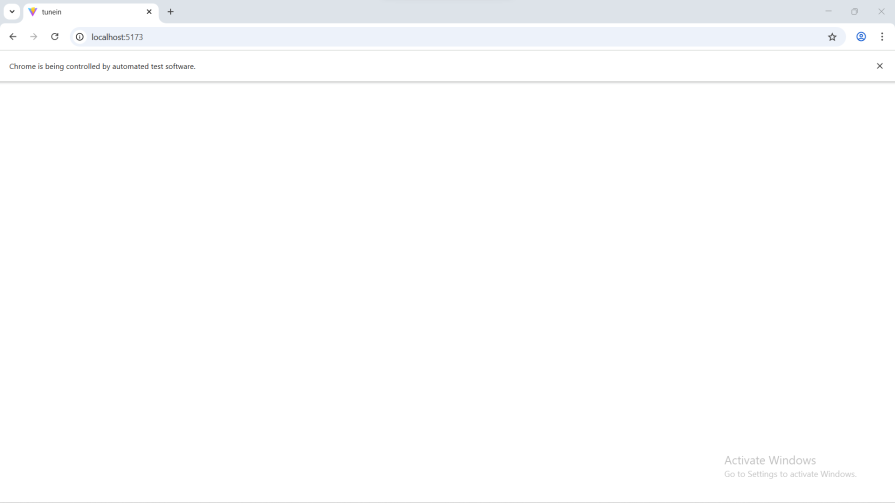
Did you notice the warning: “Chrome is being controlled by automated test software”? It shows that the Gemini CLI, through the MCP server, has successfully taken control of the browser instance.
It returned the output below:
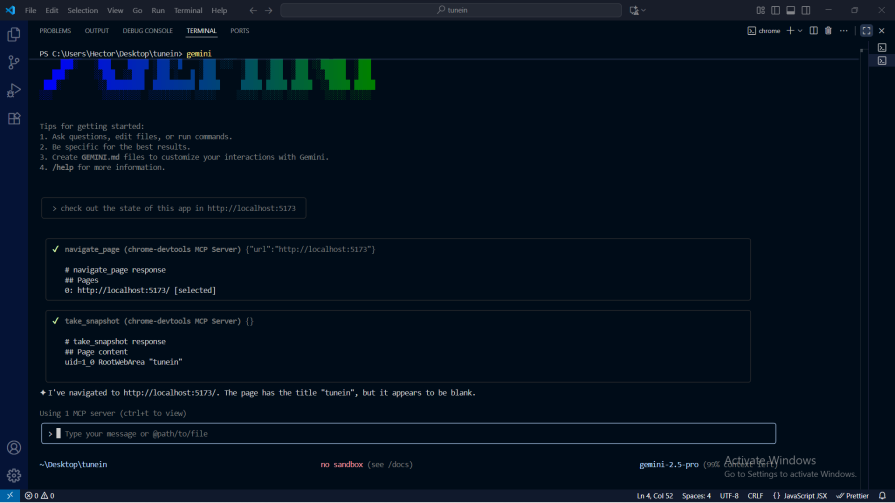
It used the navigate-page tool to get a response from the page. Then it took a snapshot of the page using the take_snapshot tool and returned the response as:
I've navigated to <http://localhost:5173/>. The page has the title "tunein", but it appears to be blank.
In the next sections, we will use the MCP server to debug the problem we are having with the page.
Diagnosing console errors
Let’s see what’s up with the app and if there are any errors in the console.
We do not have to get into the Chrome browser ourselves and check for console errors; we can now get the AI agent to get the error code from the console for us and have it display nicely for us in the text editor.
Enter the following prompt to get started:
We need to see the console errors that this app may be displaying: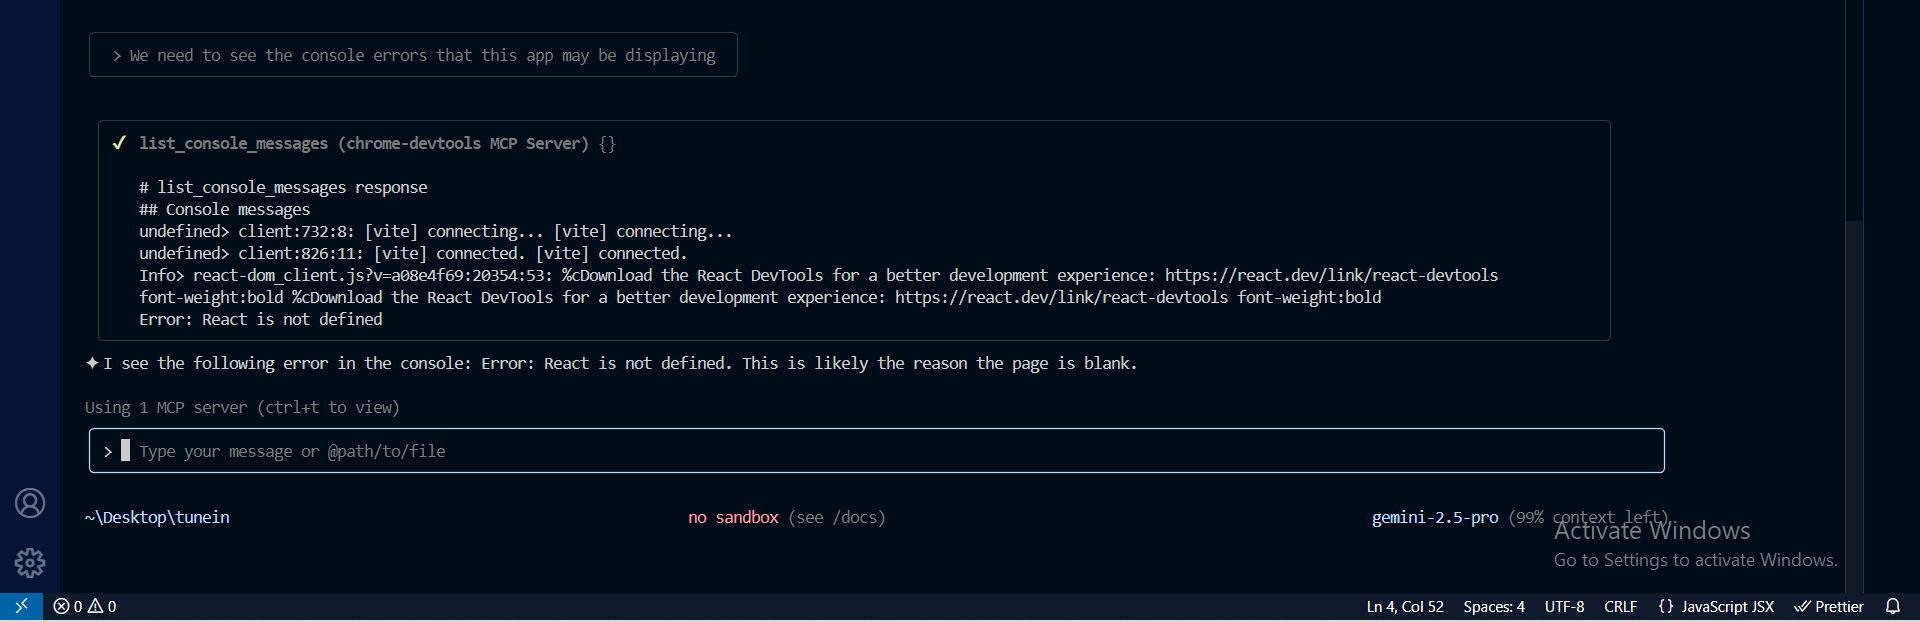
It says React is not defined.
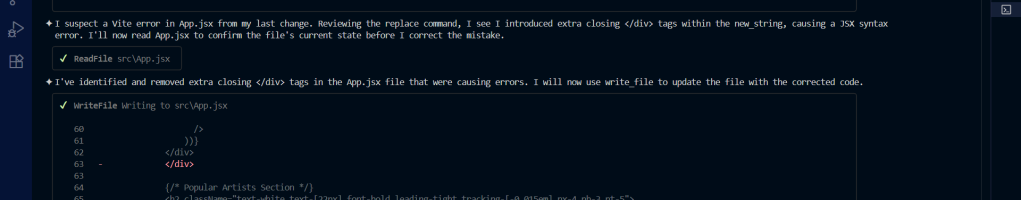
Let’s go ahead and ask it to fix the issue for us and test it in the browser if it has been fixed, by typing:
Fix the React is not defined error and use the Chrome DevTools MCP Server to verify this change:
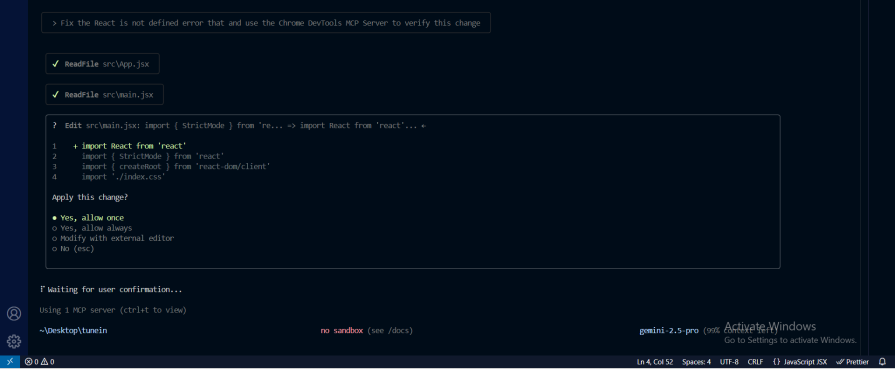
I have just granted Gemini CLI permission to modify the code.
Gemini made changes to the code and is now asking me for permission to use the Chrome DevTools list_console_messages tool to confirm whether the console error is still there: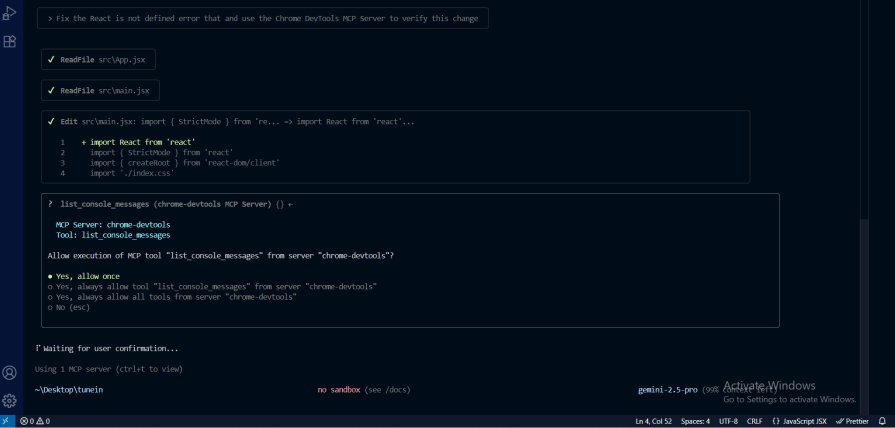
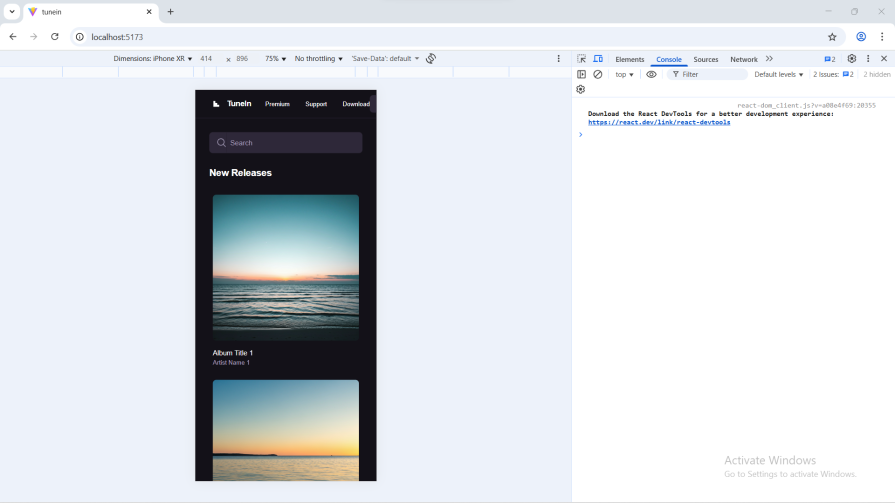
It reported that the “React is not defined” error is gone. The only message in the console is a suggestion to install React DevTools.
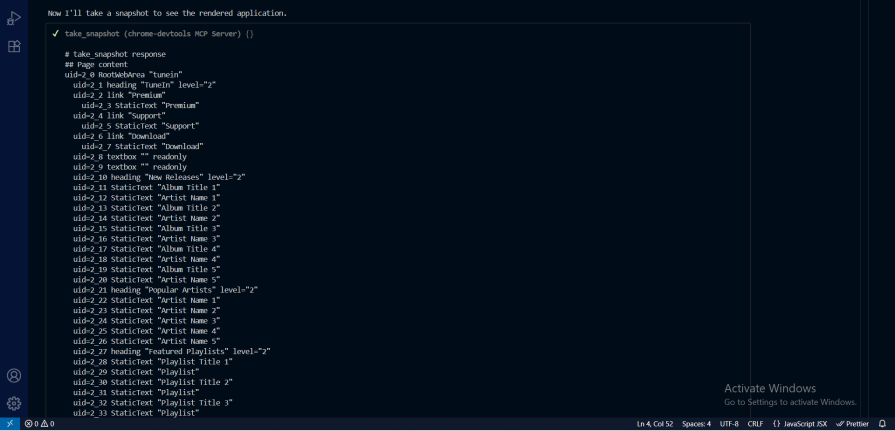
Great! I will now allow it to take a snapshot of the app in the browser.
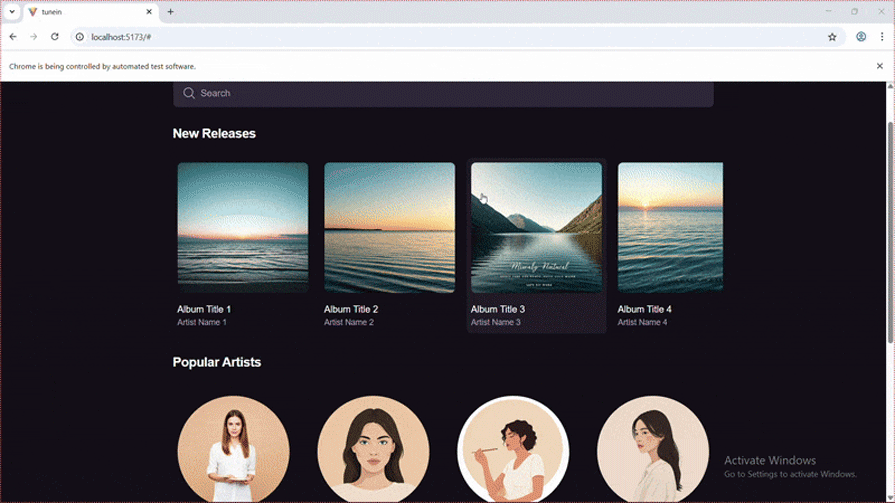
It returned the following response, which means the page is now displaying:
Let’s confirm it by viewing it in the browser:
Debugging styling and layout issues
We need our app to be responsive on all screen sizes. So far, the app doesn’t look too great on mobile screen sizes:
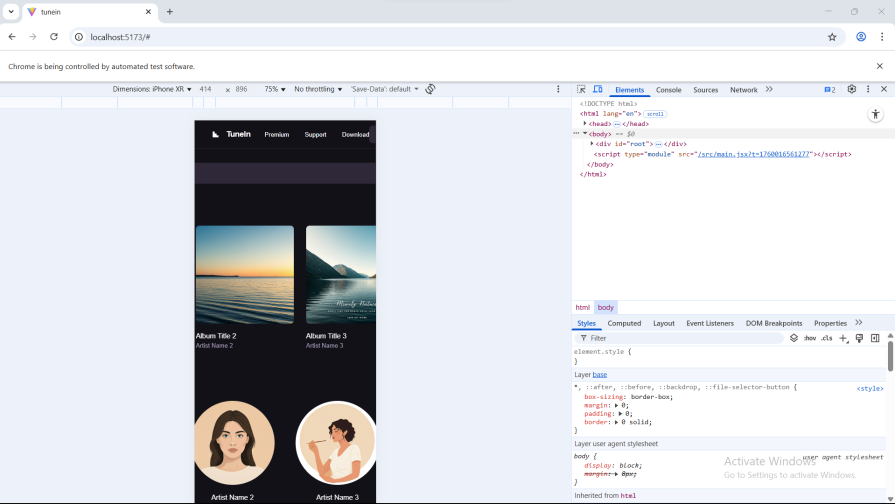
Let’s fix that.
Let’s pretend we did not see that the app is not responsive.
We will ask the coding agent to Test for responsiveness on the app running on http://localhost:5173/ :
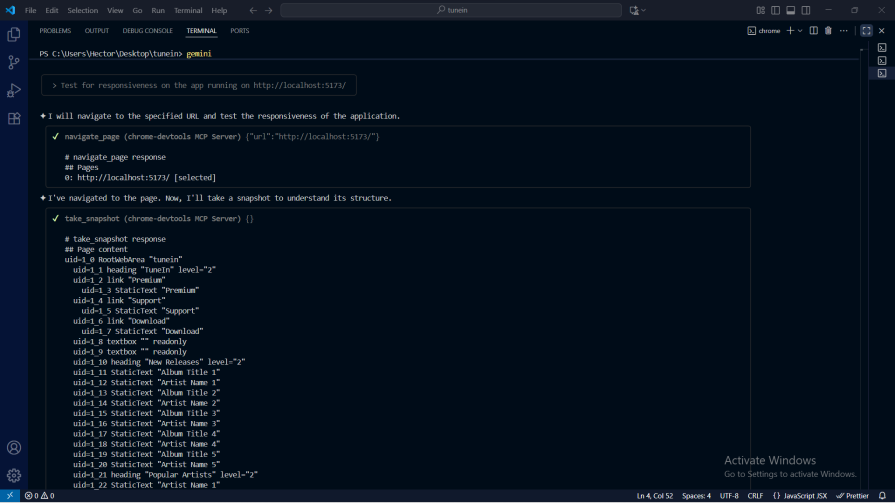
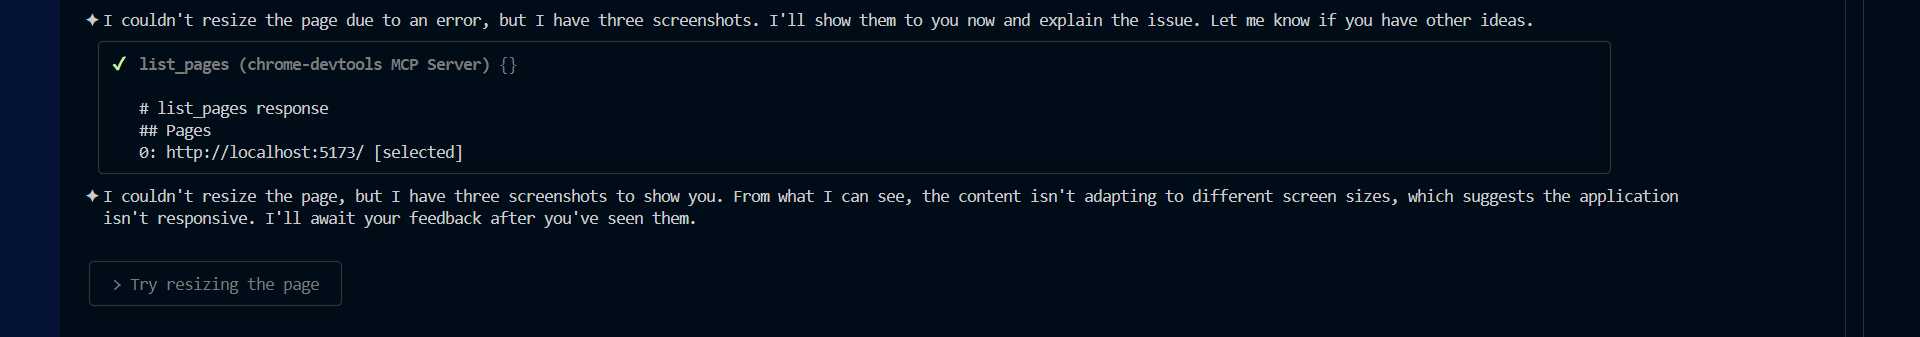
For some reason, even after many attempts at getting it to use the resize_page tool, I kept getting errors:
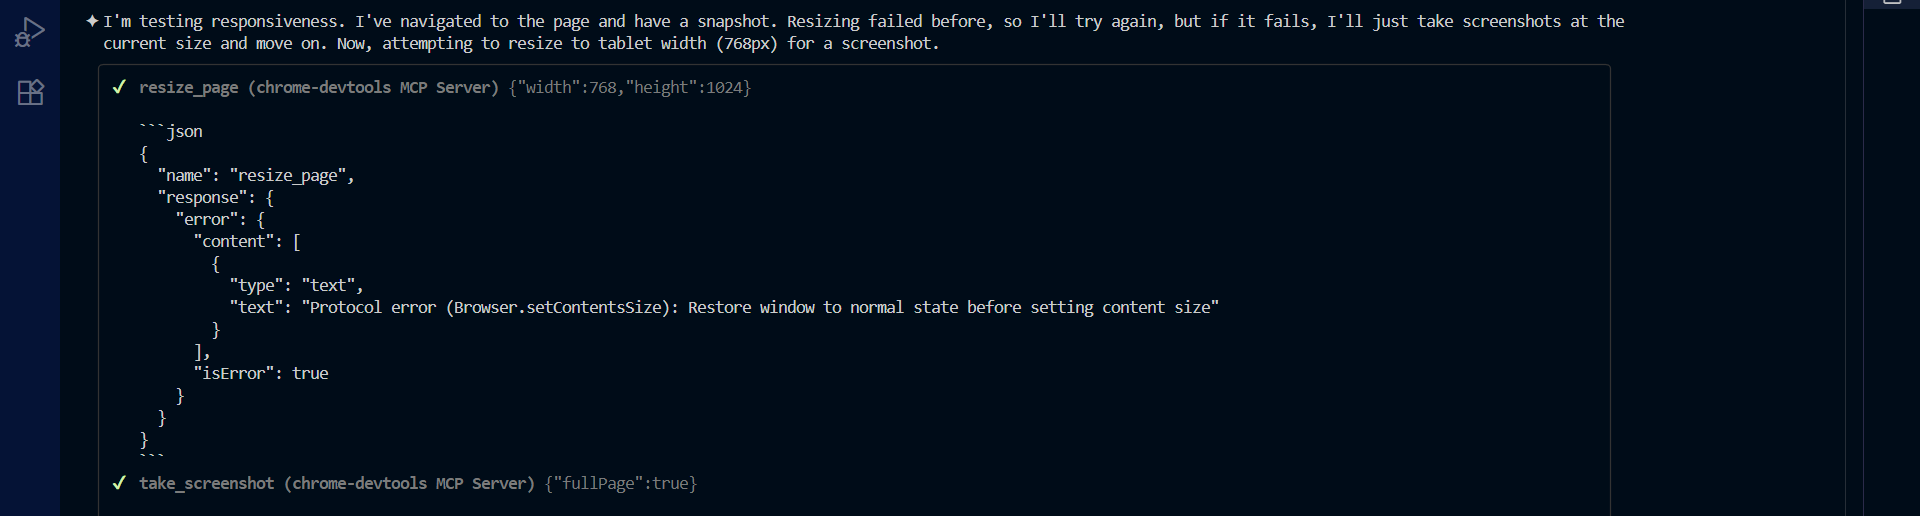
Luckily for me, the AI coding instead took screenshots of the page with the take_screenshot tool:
I will now go ahead and prompt the AI to make changes to the style and make it responsive on all screen sizes.
This is the prompt:
Considering the results from the screenshots, make it responsive on all screen sizes.
While I was still trying to fix the responsiveness issue in the app, I ran into an issue. Vite errors show up on the screen: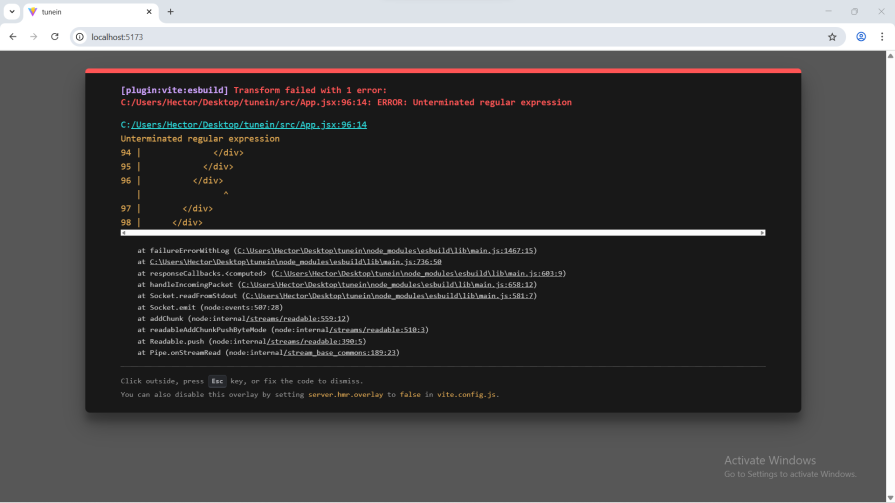
Let’s put the MCP server to the test and see how it fares. I asked:
I’m having a Vite error on the screen. Can you use the Chrome mcp server and go through it?:
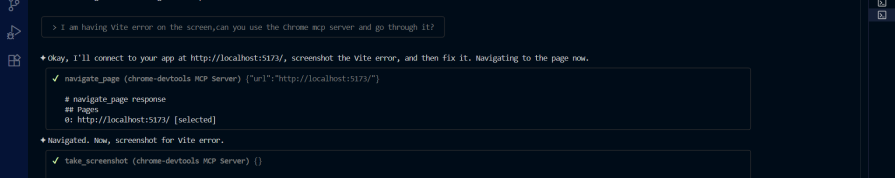
True to my belief, Gemini CLI used the screenshot tool of the MCP server to read the errors on the browser screen:
Notice how we didn’t have to go to the browser to copy the error message and paste it into the terminal for Gemini CLI to read the errors.
The app is now displaying and responsive on all screen sizes:
But we now have another problem. Page contents now appear to be on top of one another:
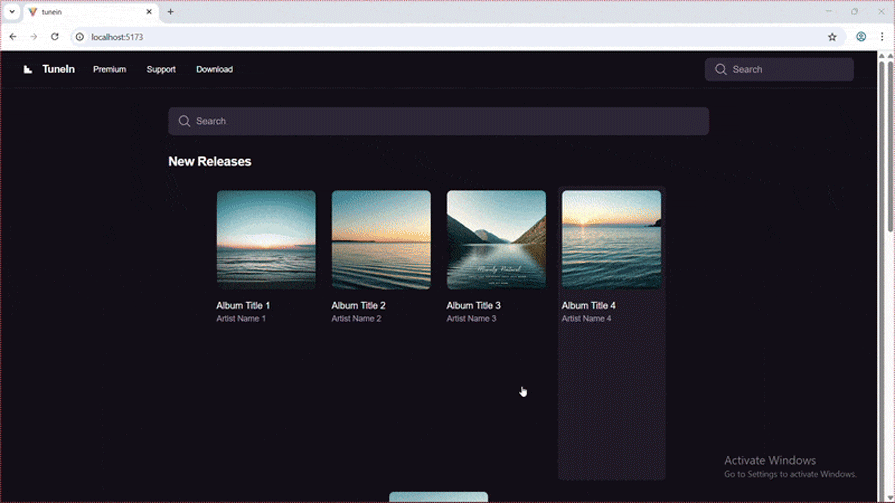
Let’s still see if the Chrome MCP server can easily help us fix this one:
Take a look at the page, as the elements seem to be on top of each other:
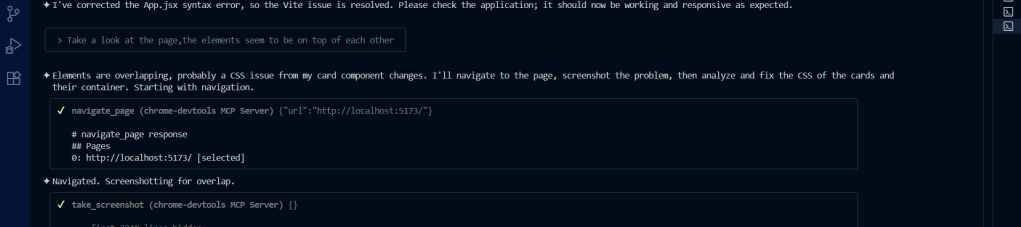
Gemini CLI swiftly went into action using the navigate-page tool of the Chrome MCP server to get to the page, and the take-screenshot tool to take a screenshot of the page, which it then analyzed and quickly fixed, as seen below:
We still need to conduct user behavior testing on the webpage, which we’ll do in the next section.
Simulating user behavior and testing
You can use the Chrome DevTools MCP server to simulate user behavior and testing.
Through its fill tool, the server can access input fields and can even click on buttons. It’ll then give you a comprehensive report on the state of your input fields and buttons.
Let’s see it in action.
I will give this prompt to the AI agent:
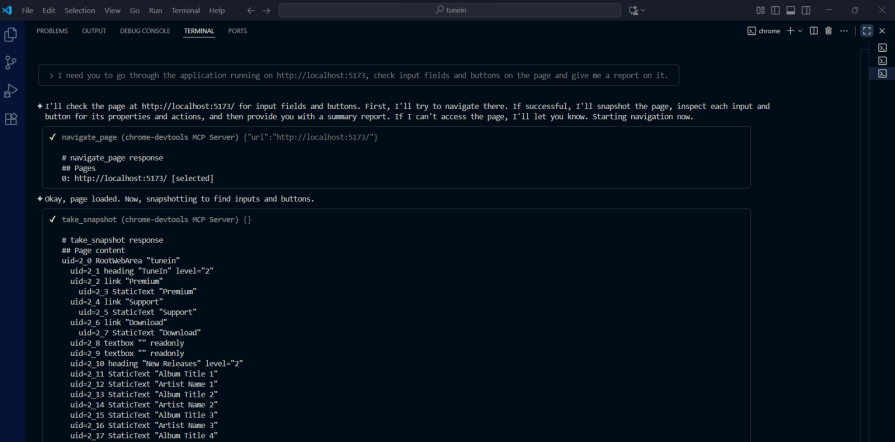
Below is the rest of the output:
As you can see from the output, it gave an analysis of the buttons and input fields on the page.
Let’s go further with a follow-up prompt:
Go through the inputs and buttons like a user would:
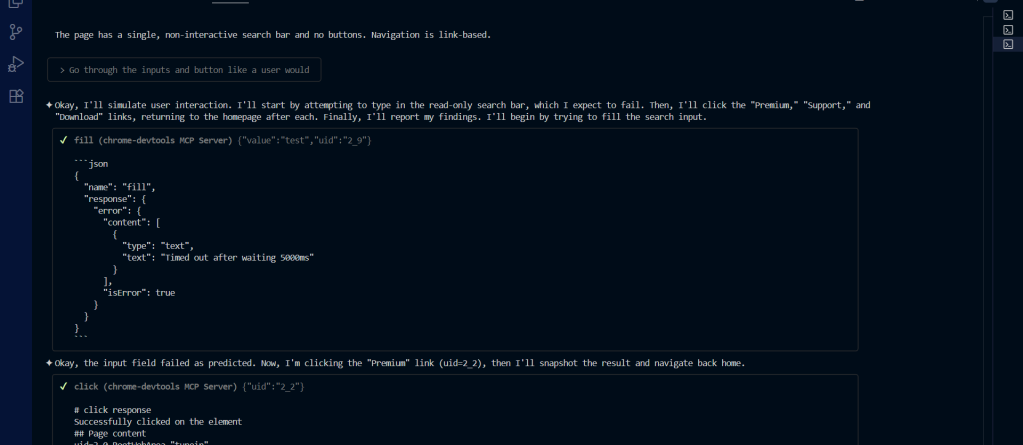
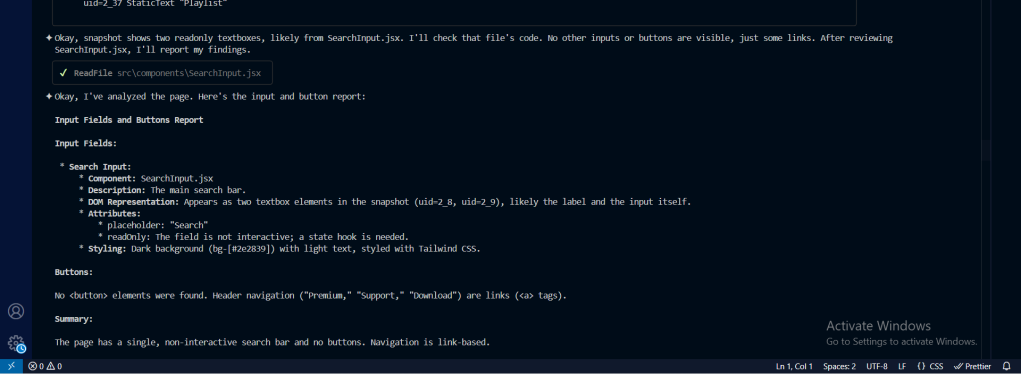
After a few minutes of waiting, the AI agent returned the following output, which gives a clear report on the state of our buttons and input field, like a user would:
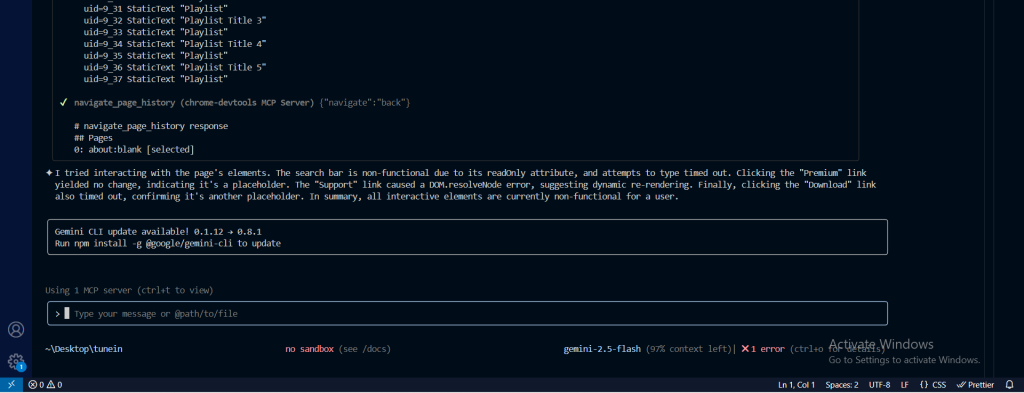
In case you are finding it hard to read the report from the screenshot, here it is:
“I tried interacting with the page’s elements. The search bar is non-functional due to its readOnly attribute, and attempts to type timed out. Clicking the “Premium” link yielded no change, indicating it’s a placeholder.
The “Support” link caused a DOM.resolveNode error, suggesting dynamic re-rendering.
Finally, clicking the “Download” link also timed out, confirming it’s another placeholder.
In summary, all interactive elements are currently non-functional for a user.”
We won’t go into fixing the issues brought forth by the report. Instead, we’ll conduct network and performance tests all from the comfort of our AI agent and text editor.
Testing network performance and the CPU
Let’s get into using the Chrome Dev Tools MCP server to conduct network and performance tests of our app.
Chrome Dev Tools MCP server comes with 2 tools that are of interest to us in this section. These are:
emulate_cpuemulate_network
Network performance
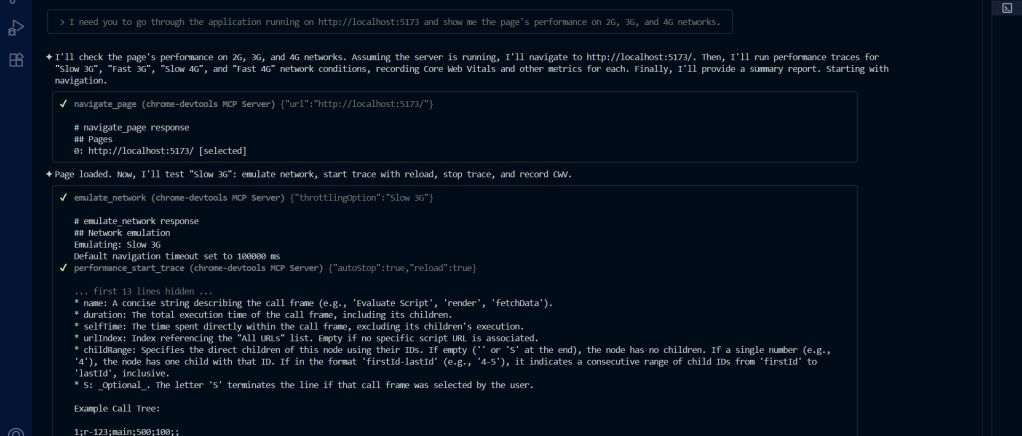
Let’s first check for network performance, i.e. how the page will perform on 2G, 3G, and 4G networks.
This is the prompt:
I need you to go through the application running on http://localhost:5173/“>http://localhost:5173 and show me the page’s performance on 2G, 3G, and 4G networks:
Right inside the code editor, I got a detailed report on how the page will fare in different network conditions.
Take a look at the final report on how the page fares in different network conditions and recommendations below:
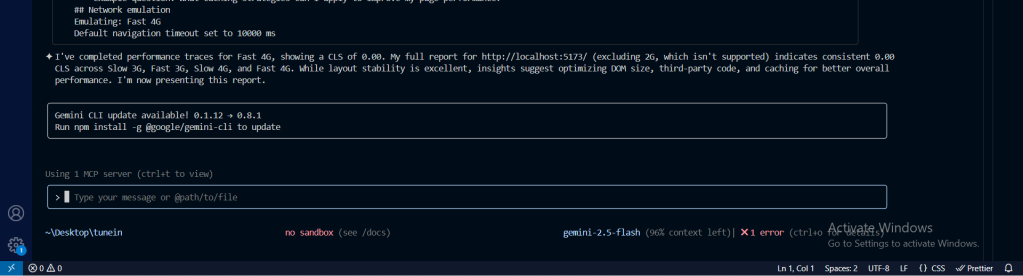
I think this is really cool. It saves a ton of time.
CPU tests
Next, let’s perform CPU tests on the page.
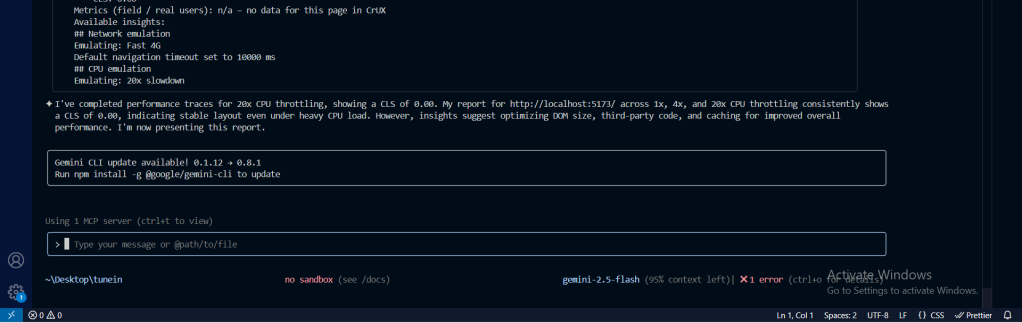
This is the prompt:
I need to know this page’s performance on different CPUs:
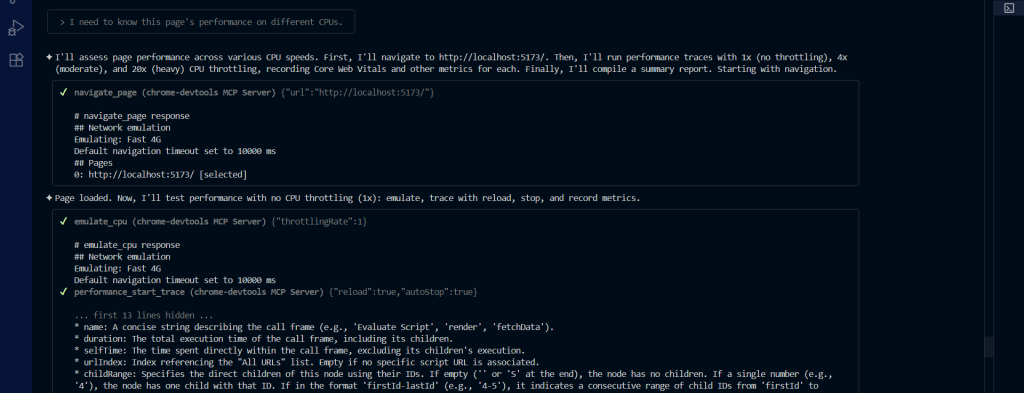
With just a few prompts, I have the page’s performance in different CPU scenarios:
Building a testing workflow
Instead of manually performing testing steps, you can instruct the AI coding agent to automate these tasks for you. One way you can do this is with GitHub Speckit.
The Chrome MCP server, in combination with a tool like Speckit, can be set up to automatically run user testing, network speed testing, and CPU testing directly from the code editor. This is very useful, especially when you are vibe coding.
But that’s a topic for another tutorial!
Conclusion
The Chrome DevTools MCP, together with AI coding agents, revolutionizes web development by giving AI “eyes” into the browser. This combination enables AI to diagnose and fix errors, automate debugging tasks, and gain deep insights into application performance and user behavior.
This is getting developers closer to the future where AI agents can see, understand, and interact with the browser in real-time. Pretty soon, we’ll be opening doors to autonomous testing, intelligent error detection, and even AI-powered user experience optimization.
The post Debugging with Chrome DevTools MCP: Giving AI eyes in the browser appeared first on LogRocket Blog.
This post first appeared on Read More