
Why you should treat data as inventory, not infrastructure
If you’ve ever had a feature slip because “the data wasn’t ready,” this article is for you. As PMs, we’re great at wrangling dependencies when they look like APIs, SDKs, or design systems. But we often treat data like infrastructure, until it delays a launch, derails an experiment, or erodes trust in a KPI.

I want to encourage you to shift towards treating data as inventory, not infrastructure. That means managing data like a real product that your team depends on, tracking things like its quality, freshness, lead time, cost, and ownership to keep it organized, reliable, and accountable. When you do, you start asking the right questions, making clearer promises, and shipping on time more often.
That all sounds nice, doesn’t it? But what does it mean in practical terms to “treat data as inventory, not infrastructure?”
I found myself asking that question while working on a project that started to miss its marks because of data reliability issues. The answer changed the way I approach data product management for the better.
This article is a playbook you can drop into your product rituals next week, written for PMs who want fewer surprises and more predictable delivery. Let’s get started.
The cost of unmanaged data dependencies
A little while back, the product team that I managed was building a retention dashboard to guide pricing and lifecycle triggers. The linchpin was a customer identity dataset, which seemed straightforward: daily freshness, stable schema, easy joins. In reality, the identity resolution job lagged 24-60 hours under peak load.
Issues started cropping up over time. A column rename slipped into production without a heads-up. The dashboard missed its window. Worse, a feature that reused those same identifiers slipped too. Engineering looked “done,” but our information supply wasn’t.
This is the hidden failure mode of modern product development. Data reliability issues hide inside sprint commitments and only reveal themselves at the end. And when they do, the fix isn’t a better dashboard — it’s proper inventory management.
If your feature depends on data, you own that dependency just like you would an external API. You need a contract (schema plus SLA), an escalation path, and a shared understanding of quality and lead time. Otherwise, you’re making date promises with invisible risk baked in.
Data products as managed assets, not dashboards or pipelines
A data product is a packaged dataset built for reuse, with clear purpose, quality expectations, and accountability. It needs to be treated like a product: planned, maintained, and relied on.
Think of a data product as a reusable source of truth with explicit commitments: schema stability, freshness, access patterns, and lineage. It’s durable, lives on a roadmap, accrues technical debt, and has owners and consumers.
It’s not “the pipeline” (that’s the conveyor belt) and it’s not “the dashboard” (that’s a view). A data product is the shelf-stable inventory other teams rely on.
The following table outlines how this differs from other data artifacts:
| Asset type | Purpose | Contract surface | Stability | Consumers | Success measure |
| Data product (identity table, feature store, partner feed) | Reusable information | Schema, freshness SLA, access pattern, lineage | Versioned & predictable | Multiple teams / services | Reliable reuse; decision throughput |
| Pipeline | Move / transform data | Run books, job timing | Variable | Upstream / downstream jobs | On-time runs |
| Dashboard / report | Human interpretation | Metric definitions, filters | Medium | Analysts, execs | Accurate, timely insight |
| Ad-hoc view | One-off exploration | Minimal | Low | Individuals | Short-lived utility |
When you treat data like a product, it follows a clear lifecycle: creation → evolution → deprecation → retirement. Without that structure, datasets accumulate without ownership, grow stale, and quietly break things downstream.
In practice, this means managing data the way you manage APIs. Treat breaking changes with care:
- Plan them in advance
- Version them clearly (e.g., customer_v2)
- Set deprecation windows
- Provide simple migration guides
You’re not just producing tables, you’re maintaining products that others rely on. So don’t measure value by volume. Measure it by:
- How reliably the data is reused
- How many decisions or features safely depend on it
- How quickly teams can move because they trust it
That’s how data becomes leverage, not liability.
Thinking in inventory terms
Inventory has real costs and value. So does data. When you talk about data in those terms, it’s easier to explain and justify decisions.
Your team might want real-time personalization. Streaming supports sub-minute freshness, but it’s expensive to build and run. Micro-batching every 15 minutes is cheaper, but less fresh. That’s a tradeoff: freshness versus cost.
Framed this way, it becomes a business decision.
Freshness, cost, latency (pick two, on purpose)
Streaming gives sub-minute freshness but costs more to serve and operate. Micro-batching buys intra-hour freshness at a reasonable cost. Daily batches are cheap and fine for stable decisions.
For each major data product, ask: What is the unit cost of additional freshness, and who funds it? If personalization needs 15-minute freshness to move a KPI, that’s an investment story, not a hope.
Lead time and volatility
Lead time is the distance between upstream change and downstream usability. Volatility is how spiky demand or source stability is. Long lead time plus high volatility equals fragile roadmaps.
Options include buffering (feature flags, rollout windows), decoupling (caches, contracts that absorb change), or shortening lead time (automate backfills, kill manual approvals, tighten batch windows).
Defect rates (quality)
Returns tell you how your supply chain performs. Track null/duplicate rates on key fields, schema drift incidents per quarter, and SLA breaches per 1,000 runs. Not to punish, to prioritize.
Fix the biggest offenders first; quality improvements compound across every downstream consumer.
A simple scorecard to guide investment and promises
Use this one to five scale to assess each data product. One means weak or unreliable (e.g., stale, high-defect, hard to use). Five means strong, trustworthy, and ready for reuse. The goal isn’t perfect scores, it’s visibility. Scores help you spot weak links, prioritize fixes, and make clearer trade-offs:
- Freshness versus need — Does real-world freshness meet the decision need?
- Lead time — Hours, days, or weeks from change to reliable consumption?
- Demand volatility — Predictable, seasonal, or spiky and surprising?
- Defect rate/quality — How often do we break? How severe?
- Cost-to-serve — Are unit costs known and attributed?
- Consumption complexity — Are interfaces self-serve, documented, and stable?
This isn’t about perfect scores. It’s about honest scores that drive better commitments and more thoughtful trade-offs.
Managing contracts between producers and consumers
Now, before we get into contracts, let’s define what I mean by the roles.
Producers are the teams or systems that create, transform, or own datasets, often data engineering, platform teams, or upstream services.
Consumers are the teams that rely on that data to build features, power dashboards, run experiments, or make decisions, typically product teams, analysts, ML engineers, or downstream services.
A contract is the shared agreement between them, what data is available, how fresh it is, what it means, and what happens when it changes. Just like APIs, these expectations need to be explicit, versioned, and maintained. Otherwise, features break silently and decisions get made on shaky ground.
Run data like you run your external API.
1. Producer-consumer agreements (PCAs)
Publish the schema with semantics (not just types), a freshness SLA (“P95 ≤ 30 min; P99 ≤ 60 min”), lineage to critical upstreams, access patterns (batch, streaming, API), and a dead-simple escalation path (on-call hours, Slack channel).
If a consumer can’t answer “What fields can I trust and who do I ping?” in five minutes, the contract isn’t done.
2. Versioning with deprecation windows
Breaking change? Don’t “hot-edit” a popular table. Ship v2, announce a deprecation date for v1, include sample queries and a field mapping in the migration guide, and backstop the migration with tests or fixtures.
You’ll turn five surprise incidents into one planned upgrade.
3. Lightweight, auditable governance
You don’t need a committee. You need three artifacts:
- Ownership table (who funds it, who’s on call, who approves schema changes)
- Change log (what changed, why, migration notes, impact)
- Incident reviews (root cause, follow-ups, next review date)
Why does this reduce coordination cost? When contracts are visible and versioned, 80 percent of coordination moves from meetings to docs.
Consumers self-serve, PMs reduce buffers, and delivery stops being a guessing game.
Operating model: Classification, ownership, and cadence
Not every dataset needs the same guarantees, or the same investment. Classifying data by business criticality helps you decide where to focus effort.
This includes how important the data is, how often it’s used, and how long it needs to stay reliable. It sets the stage for the right level of ownership, funding, and process.
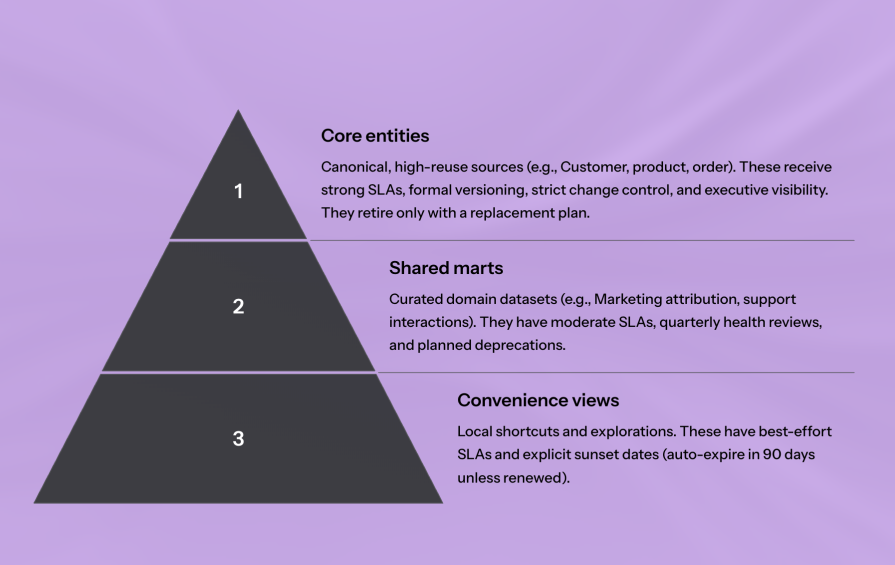
Classify by business criticality (with sunset rules)
| Category | Purpose | Examples | Management |
| Core entities | Canonical, high-reuse sources | Customer, product, order, Identity Graph | Strong SLAs, versioning, strict change control, exec visibility. Retire only with a replacement |
| Shared marts | Curated domain-level datasets | Attribution mart, support interactions | Moderate SLAs, quarterly reviews, planned deprecations |
| Convenience views | Local shortcuts, ad hoc queries | Team-specific joins, temporary views | Best-effort SLAs, auto-expire in 90 days unless renewed |
Assign ownership and funding to align incentives.
Core entities often sit with a central platform/data team; marts and convenience views can live with domain teams. If many teams benefit, finance centrally; if one team benefits, they pay. Tie reliability investments to KPI impact, not vague “data quality.”
Run a predictable cadence:
- Reliability review (monthly) — Freshness, defect rates, SLA breaches, top incidents, follow-up progress
- Lead-time compression (quarterly) — Identify the longest bottlenecks (flaky upstream, manual gating, slow backfills) and remove one per quarter
- Decision throughput and adoption (monthly) — Active consumers, queries/jobs per day, features powered, and reuse trends. Celebrate reuse like you celebrate feature launches, both create leverage
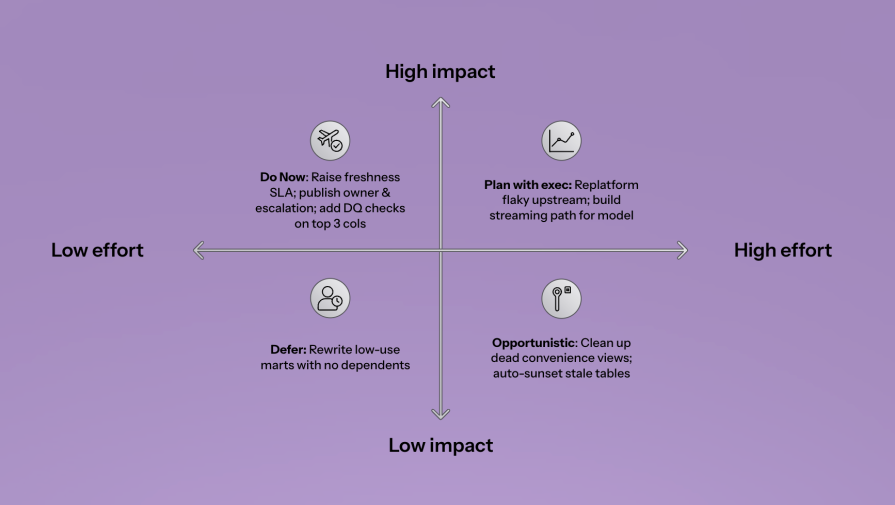
Use the scorecard (from the inventory section) to make decisions:
- Ownership — Centralize anything scoring low on quality and high on reuse
- Reliability goals — Raise SLAs where throughput or revenue depends on freshness
- Classification — Promote convenience views that show high reuse; demote marts that go stale
- Investment priorities — Move a three to a four where that unlocks the most roadmap confidence
Conclusion
Treating data as inventory aligns PMs, data engineers, and analysts around a shared responsibility: making and keeping promises. When you do this, freshness becomes a priced, owned choice, not a hope, contracts replace assumptions, versioning replaces surprises, and features stop living at the mercy of invisible breaks.
Ultimately, you’ll drive more predictable delivery with clearer dates and fewer “we’re blocked on data” updates. A roadmap that behaves like a promise.
As a final note, you can use this quick PM checklist to put this in motion this week:
- Map your top three features to their data products and list the owners
- For each, document schema semantics, freshness SLA, lineage, and escalation
- Score them one to five on freshness fit, lead time, volatility, defects, cost transparency, and consumption complexity
- Classify each dataset (core entity, shared mart, convenience view) and set or reaffirm a sunset rule
- If any score ≤ two on freshness or quality, create a versioning + deprecation plan and set a target SLA (e.g., P95 ≤ 30 minutes)
- Start a monthly reliability review and add decision throughput as a standing metric in your product review
Adopt this, and you’ll manage data like the inventory that fuels your product line — counted, owned, priced, and ready when you need it.
Featured image source: IconScout
The post Why you should treat data as inventory, not infrastructure appeared first on LogRocket Blog.
This post first appeared on Read More