
AI-powered Slack workflows for PMs who hate dashboards
As a product manager, your day is fragmented across tools. You track product metrics, review sprint health, monitor customer behavior, answer stakeholder questions, and unblock execution, often switching contexts dozens of times an hour.

Even if you enjoy working with data, it adds up quickly. Performance metrics live in dashboards, sprint insights sit in Jira, and customer signals are buried in support tools, analytics platforms, and logs. Making sense of it all becomes a job in itself.
We reached a breaking point when dashboards stopped helping us make faster decisions. They showed what happened, but rarely when to act.
This is where AI-powered Slack workflows changed how we operate.
Instead of pulling information from multiple tools, we now push decision-ready insights directly into Slack. AI monitors product data, sprint execution, and customer signals in the background and surfaces only what matters, when it matters, and with clear context.
In this post, I’ll walk through practical examples of how we use AI inside Slack to automate product intelligence and execution workflows. The goal isn’t more automation. It’s fewer manual checks, faster signal detection, and better decisions with less cognitive load.
Turning raw product data into AI-ready insights
One of the biggest challenges for our product team is turning raw data into clear action items.
We take in large volumes of information from customer feedback, support tickets, usage metrics, error logs, Google Analytics and BigQuery reports, and NPS results. On the delivery side, we also track development cycle times, Jira sprint metrics, and throughput.
From an internal optimization perspective, we regularly review four key delivery metrics:
- Deployment frequency
- Cycle time
- Mean time to restore
- Change failure rate
Understanding trends across these metrics and identifying concrete actions is difficult when the data lives across multiple tools and reports.
To address this, we built an n8n workflow connected to an internal AI agent. The workflow analyzes sprint and delivery data, detects anomalies, and proposes improvement ideas that are automatically added to our four key metrics sheet:
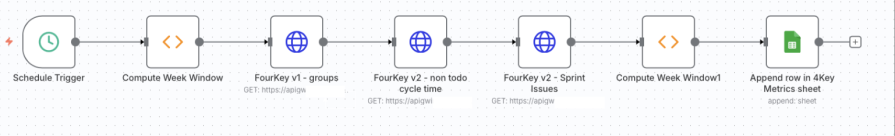
Tools used:
- Jira
- n8n
- Internal AI agent
- Google Sheets
Previously, a dedicated team member prepared this data manually before every metrics meeting. Now, the team focuses on preventive actions and trends instead of data collection.
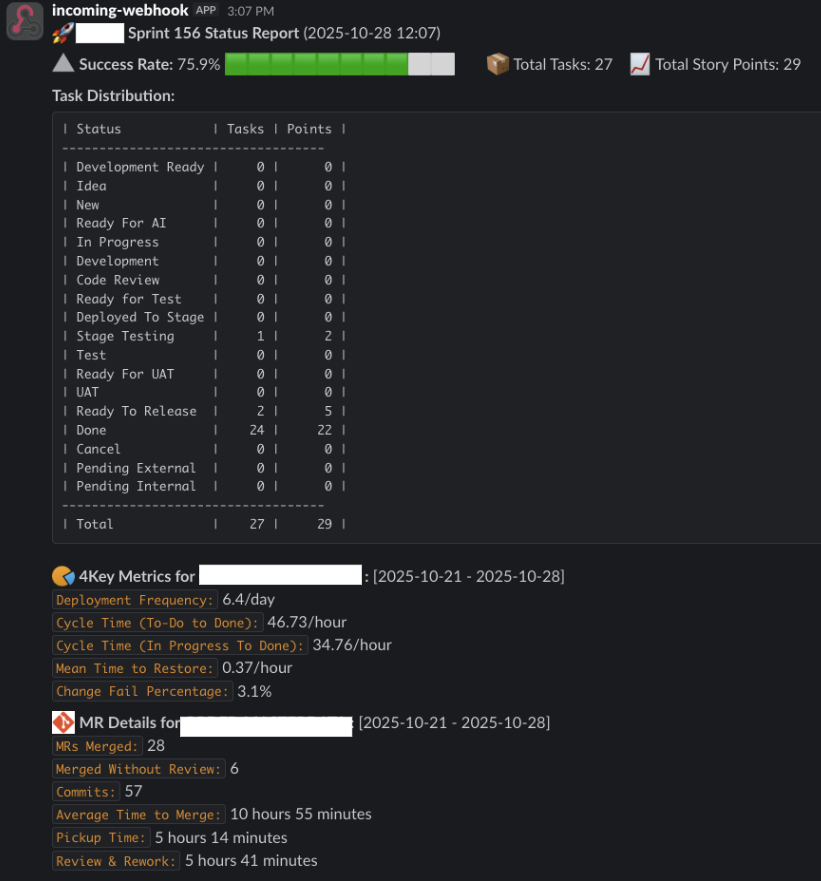
We also integrated the workflow with Slack so the team only receives alerts when sprint success rates deviate from expectations.
Next, we plan to add actionable recommendations directly into sprint messages, allowing teams to intervene before a sprint fails rather than reacting afterward:
Building Slack alerts for real-time customer signals
Our company handles a large volume of customer data across support tickets, usage logs, and product metrics. Manually monitoring dashboards throughout the day is time-consuming and reactive.
We initially relied on Looker dashboards backed by BigQuery, but daily manual checks proved inefficient. To shift towards prevention, we built an internal AI-based anomaly detection system.
We trained the model using historical data and labeled outcomes such as the following:
- Acknowledged
- No action needed
- Incident
- Fraud
- Fixed
To reduce risk, we added a human review layer during early deployment and started with lower-impact signals.
The core flow looks like this:
- AI monitors product usage patterns
- AI detects anomalies (drops or spikes)
- Slack receives a concise alert with context and suggested action
We chose the ARIMA (autoregressive integrated moving average) model for time-series anomaly detection, which works well for identifying unexpected deviations from historical patterns.
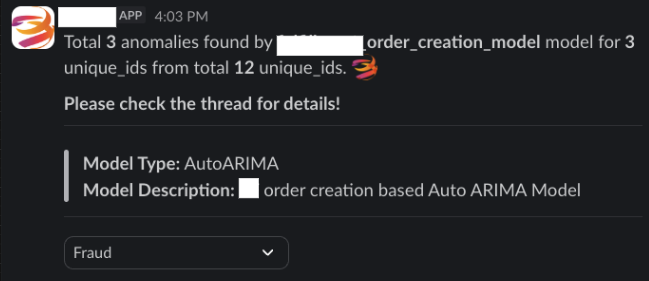
Example Slack alert:
 Anomaly detected
Feature: User actions
Details: Six anomalies found
Possible cause: Fraud users generating unexpected data volume
Tools used:
- BigQuery
- n8n
- Internal AI agent
- Slack
As a result, we no longer spend time manually searching for fraud patterns. The process now routes directly to our customer success teams, allowing them to act without waiting for PM analysis.
Automating execution visibility with Jira, Slack, and AI
Sprint tracking often turns into status chasing. When you miss daily meetings or juggle overlapping schedules, visibility suffers. You end up wasting time checking Jira manually or asking your team for updates.
Our first automation focused on sprint status summaries and executive risk detection.
Jira already exposes the necessary data through APIs. Slack provides the delivery surface. AI closes the gap by interpreting sprint health and highlighting risks:
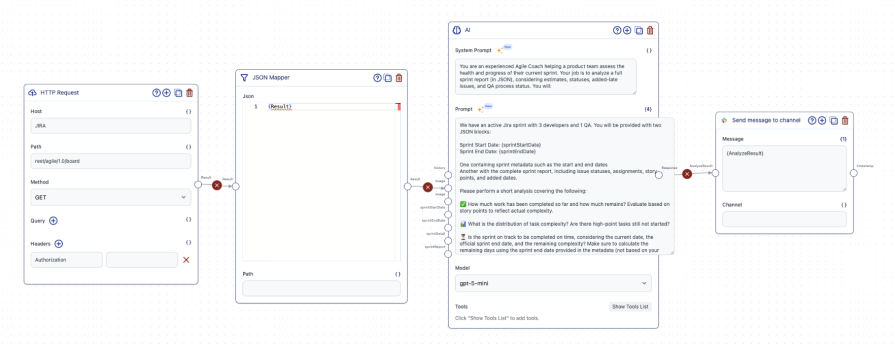
To keep our sprint summaries consistent while still adapting to real-time sprint data, we split our prompt into two layers:
- A stable system prompt that defines how the AI should reason about sprint health
- A dynamic execution prompt that injects sprint-specific context and data
System prompt:
You are an experienced agile coach helping a product team assess the health and progress of their current sprint.
You will be provided with a complete sprint report in JSON format, including estimates, issue statuses, story points, added dates, and QA process status.
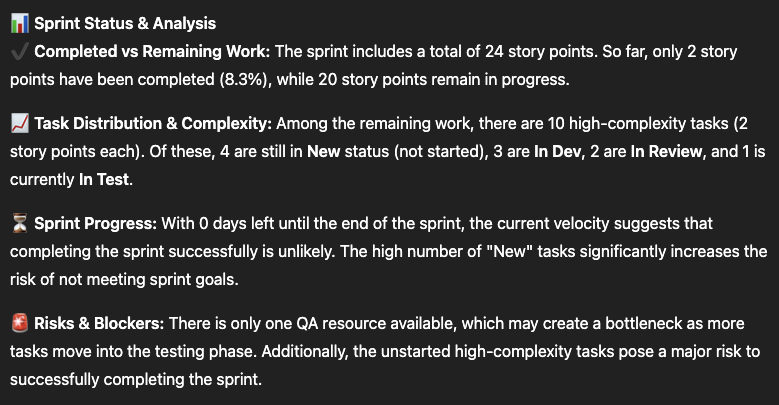
Your task is to analyze the sprint data and produce a concise, actionable sprint summary.
Specifically, you will:
- Determine how much of the planned work has been completed and how much remains, based on story points
- Identify the distribution of task statuses (for example, not started, in development, in testing, done)
- Evaluate whether the sprint is on track to finish successfully based on remaining work and the time left in the sprint, using only the data provided
- Detect blockers or risks such as tasks stuck in development or testing, high-complexity tasks not yet started, QA bottlenecks, or excessive mid-sprint scope additions
- Highlight issues added mid-sprint and assess their impact on the team’s ability to complete planned work
Then provide clear, role-specific guidance:
- What developers should focus on now to reduce the risk of sprint failure
- Which tasks QA should prioritize to prevent bottlenecks
- Whether re-scoping, escalation, or tradeoffs should be considered
Output requirements:
- Produce a single Slack-ready message in English
- Keep the message concise and scannable (no more than eight short bullet points total)
- Use emoji sparingly to indicate status or risk (for example: on track, at risk, blocked)
- Keep the tone professional, supportive, and action-oriented
Execution prompt:
You have an active Jira sprint with three developers and one QA.
You will be provided with two JSON inputs.
Sprint Start Date: {sprintStartDate}
Sprint End Date: {sprintEndDate}
One JSON input contains sprint metadata, including the start and end dates.
The second JSON input contains the complete sprint report, including issue statuses, assignments, story points, and added dates.
Using only the data provided, perform a short analysis of the sprint’s current health. Base all evaluations on story points to reflect actual complexity.
Cover the following in your analysis:
- How much planned work has been completed so far and how much remains, based on story points
- The distribution of task complexity, including whether any high–story point tasks have not yet started
- Whether the sprint is on track to be completed on time, based on the sprint end date provided in the metadata, the remaining work, and the implied current position within the sprint
- Any risks or blockers that could prevent successful completion, such as QA bottlenecks, high-complexity tasks still in early states, or tickets stuck in development or testing
Important constraints:
- Do not use your own system date
- Derive timing only from the sprint start and end dates and the data in the sprint report
- Avoid assumptions unless explicitly stated
Output requirements:
- Provide a short summary of exactly four sentences
- Keep the tone clear, neutral, and actionable
- Do not include raw JSON in the output
Here is the input data:
sprintDetail: {sprintDetail}
sprintReport: {sprintReport}
Example AI-generated sprint update:
 Sprint snapshot
 12 completed
 3 in progress
 3 blocked (API dependency and external approval)
The sprint is on track. Action needed by Wednesday to avoid delay.
Instead of reading raw Jira data, stakeholders get a shared, concise view of sprint health with clear next steps.
Keeping teams aligned with AI summaries
PMs spend a significant portion of their day reading Slack threads and documents. Even while catching up, your unread counts tend to keep growing.
We built AI agents that summarize Slack threads on demand. When entering a long thread, you can simply mention the agent:
- “@CoderAI can you please sum up the thread?”
We also rely heavily on Google Sheets and the Google Workspace. Thanks to AI-assisted search and summarization, we no longer manually dig through files to find answers.
We took this further by turning our internal documentation and codebase into an AI-powered Slack chatbot. Business and engineering teams now self-serve answers that previously required direct PM input.
As a domain owner, this reduced constant interruptions and allowed me to focus on higher-impact work.
Scaling delivery capacity with AI-assisted execution
As product teams face growing demands and limited engineering capacity, scaling through hiring or overtime isn’t sustainable.
We introduced several AI-assisted workflows to increase delivery capacity without sacrificing quality.
Jira task analysis and template automation
- PMs create high-level Jira tickets
- AI refines requirements, acceptance criteria, and edge cases based on historical patterns
- Developers use internal agents or tools like Cursor for technical analysis
- Standardized templates reduce grooming time and ambiguity
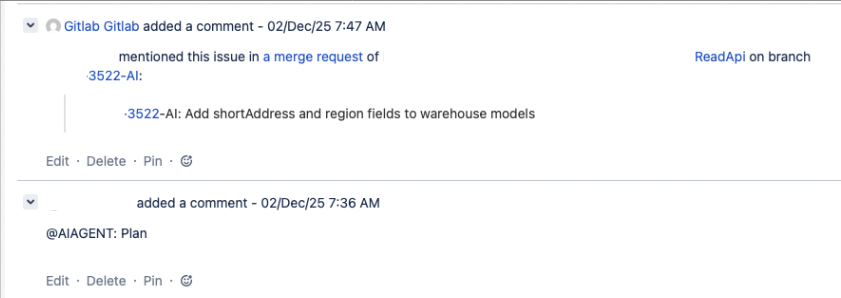
Jira AI agent for development support
- Developers mention the AI agent in a Jira comment
- The agent assists with implementation or code generation
- While AI prepares commits, developers can pick up new work
Merge request analyzer
The Al reviews merge requests for code quality, maintainability, and risk, then posts concise, actionable feedback directly in GitLab.
Prompt example:
Your task is to assess the modifications for code quality, maintainability, and potential risks. Be precise, constructive, and professional in your feedback. Avoid generic statements and focus on meaningful, code-specific insights.
Input you will receive:
- A GitLab merge request diff or description
- Context about the affected codebase, if available
When reviewing the changes, you should:
- Summarize key changes by clearly explaining what was added, modified, or removed
- Evaluate code quality, including readability, efficiency, and adherence to best practices
- Identify potential issues such as performance bottlenecks, security vulnerabilities, breaking changes, or maintainability concerns
- Provide actionable feedback that helps improve the code, not just critique it
Structure your response exactly as follows:
- Comprehensive code analysis
- Explain the purpose and impact of the changes
- Call out strengths where appropriate
- Highlight concerns or areas for improvement and explain why they matter
- Provide reasoning and context for each suggestion
- GitLab comment summary (1–2 sentences)
- Write a brief, informative summary highlighting the most important changes or risks
- Keep it concise and professional so it can be posted directly as a GitLab comment
Do not include filler, repetition, or high-level platitudes. Focus on clarity, relevance, and practical value.
Performance analysis and error detection
We created AI “diagnosers” for critical services that analyze performance metrics, resource usage, and error logs.
Each diagnosis includes:
- Resource metrics
- Performance indicators
- Error summaries
- Root cause analysis
- Actionable recommendations
Prompt example:
You are a diagnostic and analytical assistant specializing in performance analysis and error detection.
Your task is to evaluate the provided application metrics, resource usage data, and error logs to identify the most likely root cause or causes of issues and produce concise, actionable insights. Maintain a logical, focused approach and clearly connect your conclusions to the data provided. Avoid speculation. If data is incomplete, explicitly state assumptions.
Input you will receive:
- Application performance metrics
- Resource usage data
- Error logs
The data may include CPU and memory utilization, throughput, response times, restart counts, and specific error messages.
Your response must be fewer than 35,000 characters.
At the beginning of your response, always include the application name, application performance metrics, and resource metrics using the exact template below. Use clear section headers and bullet points where appropriate.
Output template:
$applicationName Application Diagnosis Summary
- Resource metrics
- CPU Usage / Limit: $cpuusage / $cpulimit (percent utilized)
- Memory Usage / Limit: $memory / $memorylimit (percent utilized)
- Restart Count: $restartcount
- Performance metrics
- Response Time / Average RT / Upper Boundary: $avgrequestduration / $weeklyavgrequestduration / $upperlimitbysttdevrequestduration
- Throughput / Average TP / Upper Boundary: $inboundthroughput / $weeklyavginboundthroughput / $upperlimitbysttdevinboundthroughput
- Error log summary
- Summarize dominant error types, frequency, and timing.
- Summary of findings
- Explain what’s happening and why. Reference specific metrics or logs that support your conclusions
- Potential causes and areas of concern
- List and rank causes from most to least likely. Indicate confidence level where possible
- Conclusion
- Provide a short paragraph summarizing the diagnosis
- Actionable recommendations
- List immediate mitigation steps
- List follow-up investigation or monitoring recommendations
Slack-based development requests
External teams submit requests through Slack channels. AI agents translate those requests into merge requests, share context in threads, and route approvals to developers.
Results
With AI-driven Slack workflows:
- Sprint velocity and SLA performance improved
- Jira story throughput increased incrementally
- Over 1,000 Jira tasks were completed with AI agent assistance
- Engineers spend less time on repetitive work and more time on complex logic
Final thoughts
AI-powered Slack workflows change where product decisions happen.
Instead of reacting to dashboards after the fact, you get early signals, shared context, and execution clarity in real time. The result is fewer interruptions, faster decisions, and more confidence in where to focus.
If you’re just starting, introduce one AI Slack workflow. Try a morning summary or an anomaly alert. Let it earn trust and become part of your operating rhythm.
The future of product management isn’t about more dashboards. It’s about having fewer decision surfaces, powered by better intelligence.
Featured image source: IconScout
The post AI-powered Slack workflows for PMs who hate dashboards appeared first on LogRocket Blog.
This post first appeared on Read More