
The feature that silently saves production systems while most developers don’t even know it exists.
I still remember the first time one of my Spring Boot applications went down in production.
Everything had worked perfectly on my laptop.
The APIs returned the correct response.
The database connection looked fine.
The tests were green.
I proudly pushed the code, grabbed a cup of coffee, and waited for the deployment to finish.
Five minutes later…
My phone buzzed.
“The application is down.”
Panic.
I opened the logs.
Thousands of lines.
Exceptions everywhere.
CPU usage was high.
Memory looked suspicious.
The application wasn’t responding.
And I had absolutely no clue what was actually happening inside my application.
I wasn’t missing better code.
I wasn’t missing another design pattern.
I was missing visibility.
That’s when a senior developer walked over to my desk.
He looked at my screen for about five seconds and asked,
“Did you enable Actuator?”
I stared at him.
“What’s Actuator?”
He smiled.
“Exactly.”
That single conversation changed the way I build Spring Boot applications forever.
Today, almost every production-grade Spring Boot application uses Actuator in one way or another.
Yet surprisingly…
Very few beginners ever learn it.
And that’s a shame.
Because Spring Boot Actuator is probably one of the most useful features you’ll ever add with just one dependency.
Imagine Driving a Car Without a Dashboard
Let’s forget Spring Boot for a minute.
Imagine you’re driving your car on a highway.
Would you drive if the dashboard didn’t exist?
No speedometer.
No fuel indicator.
No engine temperature.
No warning lights.
No battery status.
You’d have no idea whether the engine is overheating or you’re about to run out of fuel.
Eventually…
The car would simply stop.
And you’d have no clue why.
That’s exactly what running a production application without monitoring feels like.
Your application might look perfectly healthy…
Until suddenly it isn’t.
Spring Boot Actuator is basically the dashboard for your application.
It tells you what’s happening inside while the application is still running.
Instead of guessing…
You know.
Why Developers Ignore It
Most tutorials teach us things like:
- Spring MVC
- REST APIs
- JPA
- Security
- JWT
- Docker
Those are all important.
But once your application reaches production, nobody asks,
“Can you create another CRUD API?”
Instead they ask questions like:
- Is the application alive?
- Why is memory usage increasing?
- Which endpoint is slowing everything down?
- Are all beans loaded correctly?
- Did the database connection fail?
- Is the application responding?
Those questions can’t be answered by another controller.
They require observability.
That’s exactly where Actuator shines.
What Exactly Is Spring Boot Actuator?
In simple words…
Spring Boot Actuator is a module that exposes information about your running application.
Think of it as a doctor performing regular health checkups on your application.
Instead of saying,
“I’m probably fine.”
Your application can actually say,
- I’m healthy.
- My database is connected.
- Memory usage is increasing.
- These are all my endpoints.
- These are all my beans.
- Here are my JVM metrics.
Without writing any custom code.
Spring Boot gives you all of this out of the box.
Adding Actuator Takes Less Than 30 Seconds
If you’re using Maven:
<dependency>
    <groupId>org.springframework.boot</groupId>
    <artifactId>spring-boot-starter-actuator</artifactId>
</dependency>
Gradle users:
implementation 'org.springframework.boot:spring-boot-starter-actuator'
That’s it.
Seriously.
No complicated setup.
No dozens of configuration classes.
Just restart your application.
Your First Actuator Endpoint
Open your browser.
http://localhost:8080/actuator
If everything is working, Spring Boot returns something like this:
{
   "_links": {
      "health": {
         "href":"http://localhost:8080/actuator/health"
      }
   }
}
At first glance…
It doesn’t look exciting.
But don’t underestimate what you’re seeing.
That tiny endpoint is the entrance to an entire monitoring system.
The Doctor Checkup (Health Endpoint)
Let’s use another real-life example.
Imagine visiting a doctor.
The doctor doesn’t immediately perform surgery.
First, they check:
- Heart rate
- Blood pressure
- Temperature
- Oxygen level
Only then do they decide whether you’re healthy.
Your application works the same way.
Visit:
/actuator/health
Response:
{
   "status":"UP"
}
That single word—
UP
— means Spring Boot believes your application is healthy.
If your database connection dies…
If an important service fails…
The status changes accordingly.
Imagine having Kubernetes or AWS checking this endpoint every few seconds.
If the health becomes DOWN, they can automatically restart your application.
No human intervention required.
That’s production engineering.
Wait… Why Only One Endpoint?
This confuses almost everyone.
You install Actuator.
You expect dozens of endpoints.
Instead…
Only a couple appear.
This is intentional.
Imagine leaving every door of your house unlocked.
Bad idea.
Some Actuator endpoints reveal sensitive information like:
- Environment variables
- Configuration
- Beans
- Thread dumps
Spring Boot protects you by exposing only the safest endpoints by default.
When you actually need more, you enable them yourself.
management.endpoints.web.exposure.include=health,info,metrics
Or during local development:
management.endpoints.web.exposure.include=*
Never expose everything publicly in production.
Think of it as giving someone the master keys to your application.
Imagine You’re a Hospital Manager
Suppose you’re responsible for a hospital.
Would you only want to know whether the hospital building exists?
Of course not.
You’d want answers like:
- How many patients are inside?
- Which departments are overloaded?
- Are emergency rooms available?
- Which doctors are on duty?
Applications have similar questions.
Actuator provides answers through different endpoints.
Let’s look at the ones you’ll actually use.
/actuator/metrics — Your Fitness Tracker
Ever checked your smartwatch?
It tells you:
- Heart rate
- Calories
- Steps
- Sleep quality
Your application has similar vital signs.
Visit:
/actuator/metrics
You’ll see metrics like:
- JVM memory
- CPU
- Garbage collection
- HTTP requests
- Active threads
Want JVM memory?
/actuator/metrics/jvm.memory.used
Example response:
{
   "name":"jvm.memory.used",
   "measurements":[
      {
         "value":25423488
      }
   ]
}
If memory keeps increasing without dropping…
Congratulations.
You probably found a memory leak before your customers did.
/actuator/beans — Meet Everyone Inside Your Application
Imagine walking into a company with 800 employees.
You ask,
“Who’s working here?”
HR hands you the employee directory.
That’s exactly what the Beans endpoint does.
/actuator/beans
It lists every Spring Bean currently loaded.
Controllers.
Services.
Repositories.
Configurations.
Auto-configured beans.
Everything.
When debugging dependency injection problems…
This endpoint feels like magic.
/actuator/mappings — The Google Maps of Your APIs
Have you ever forgotten an API endpoint that you wrote yourself?
Be honest.
I definitely have.
You remember creating a UserController three weeks ago.
But now you’re sitting there wondering…
“Was it /users, /api/users, /v1/users, or /user/all?”
Instead of searching through your entire project, Actuator can tell you exactly what’s available.
Just visit:
/actuator/mappings
And Spring Boot will list every endpoint currently registered in your application.
You’ll see information like:
- HTTP Method (GET, POST, PUT, DELETE)
- URL Path
- Controller Method
- Handler Mapping
Imagine your application is a shopping mall.
Each shop has a different address.
The Mappings endpoint is basically the mall directory.
Instead of wandering around hoping to find the right store, you simply look at the directory.
For large projects with hundreds of APIs, this endpoint is a lifesaver.
/actuator/info — Your Application’s Identity Card
Imagine meeting someone new.
One of the first things you ask is:
- What’s your name?
- Where are you from?
- What do you do?
Applications also need an identity.
That’s exactly what the Info endpoint provides.
By default, it’s empty.
{}But you can customize it.
management.info.env.enabled=true

info.app.name=Inventory Service
info.app.version=2.4.1
info.app.owner=Pushpak
Now visit:
/actuator/info
You’ll see:
{
  "app": {
    "name": "Inventory Service",
    "version": "2.4.1",
    "owner": "Pushpak"
  }
}
This becomes incredibly useful in production.
Imagine a support engineer asking,
“Which version is currently deployed?”
Instead of logging into servers…
They simply open the Info endpoint.
Done.
🎯 Here’s Something Nobody Tells Beginners
Most developers think Actuator is just for checking whether the application is running.
It’s much more than that.
Companies don’t install Actuator because they enjoy looking at JSON responses.
They install it because monitoring saves money.
Imagine an e-commerce website.
Black Friday.
Thousands of users.
Suddenly response times become slower.
Without monitoring…
Everyone starts guessing.
Maybe it’s the database?
Maybe Redis?
Maybe Tomcat?
Maybe AWS?
Hours are wasted.
Now imagine the same application using Actuator with Micrometer and Prometheus.
Within seconds the dashboard shows:
- JVM Memory: Normal ✅
- Database Response Time: Normal ✅
- CPU Usage: 98% ❌
- HTTP Requests: 4x higher than usual ❌
Problem found.
No guessing.
That’s why experienced backend developers absolutely love observability tools.
/actuator/threaddump — When Your Application Freezes
Imagine you’re watching a restaurant.
Customers are waiting.
Orders aren’t moving.
Food isn’t coming out.
You walk into the kitchen.
Every chef is doing something different.
One is cooking.
One is washing dishes.
One is waiting for ingredients.
One is stuck arguing with another chef.
Congratulations.
You’ve just performed a Thread Dump.
Computers work exactly the same way.
Every task runs on a thread.
Sometimes threads become blocked.
Sometimes they wait forever.
Sometimes they’re deadlocked.
Visit:
/actuator/threaddump
Spring Boot shows what every thread is currently doing.
This is one of those endpoints you might never use as a beginner…
But when production freezes at 2 AM…
You’ll be incredibly grateful it exists.
Let’s Build Our Own Health Check
Up until now, we’ve only looked at the health of the application itself.
But here’s the thing…
Your application doesn’t live alone.
It depends on lots of other services.
- A database
- Redis
- Kafka
- RabbitMQ
- Payment Gateway
- Email Service
- External APIs
Your application might be running perfectly…
But what if your database isn’t?
Imagine you’re a doctor.
A patient walks into your clinic.
They say,
“I feel fine.”
But after checking their heartbeat, blood pressure, oxygen level, and temperature…
You discover something serious.
The patient thought they were healthy.
The tests told a different story.
Applications work exactly the same way.
Sometimes the application is alive…
But one of its critical dependencies has quietly died.
That’s where Custom Health Indicators become incredibly useful.
What is a Health Indicator?
Think of it as another doctor joining the medical team.
The default doctor checks basic health.
A custom doctor can check anything you want.
For example,
- Is MySQL reachable?
- Is Redis responding?
- Can I reach Stripe’s API?
- Is Kafka connected?
- Is disk space running out?
You decide what “healthy” means for your application.
Here’s a simple custom Health Indicator.
import org.springframework.boot.actuate.health.Health;
import org.springframework.boot.actuate.health.HealthIndicator;
import org.springframework.stereotype.Component;

@Component
public class PaymentGatewayHealthIndicator implements HealthIndicator {

    @Override
    public Health health() {

        boolean paymentGatewayAvailable = true;

        if (paymentGatewayAvailable) {
            return Health.up()
                    .withDetail("Payment Gateway", "Available")
                    .build();
        }

        return Health.down()
                .withDetail("Payment Gateway", "Unavailable")
                .build();
    }
}
Now imagine the payment provider suddenly goes offline.
Instead of pretending everything is okay…
Your /actuator/health endpoint can immediately report:
{
  "status": "DOWN",
  "components": {
    "paymentGateway": {
      "status": "DOWN",
      "details": {
        "Payment Gateway": "Unavailable"
      }
    }
  }
}
Now operations teams know the problem isn’t your application.
It’s the payment provider.
That tiny distinction can save hours of debugging.
How Companies Actually Use This
Let’s imagine you’re building an online food delivery app.
A customer places an order.
Behind the scenes your application contacts:
- MySQL
- Redis
- Payment Gateway
- Notification Service
- Delivery Service
- Email Service
Now suppose the Email Service crashes.
Should the whole application stop?
Probably not.
Customers should still be able to place orders.
Only email confirmations should fail.
Using Health Indicators, your monitoring system immediately knows:
Application ✅

Database ✅

Redis ✅

Payment Gateway ✅

Email Service ❌
Without Actuator…
All you’d know is
“Something isn’t working.”
There’s a huge difference.
📊 Wait… What Is Micrometer?
This is where beginners usually get confused.
People say,
“Spring Boot uses Micrometer.”
Sounds fancy.
It’s actually very simple.
Imagine every employee in your company writes daily reports.
One employee writes them in English.
Another in French.
Another in German.
Now imagine you hire a translator.
Everyone continues writing in their own language.
The translator converts everything into one common language.
That’s exactly what Micrometer does.
Spring Boot records metrics.
Prometheus understands one format.
Datadog understands another.
New Relic understands another.
Azure Monitor understands another.
Micrometer translates your application’s metrics into the format each monitoring tool understands.
Instead of writing integrations yourself…
Spring Boot does it automatically.
Pretty cool, right?
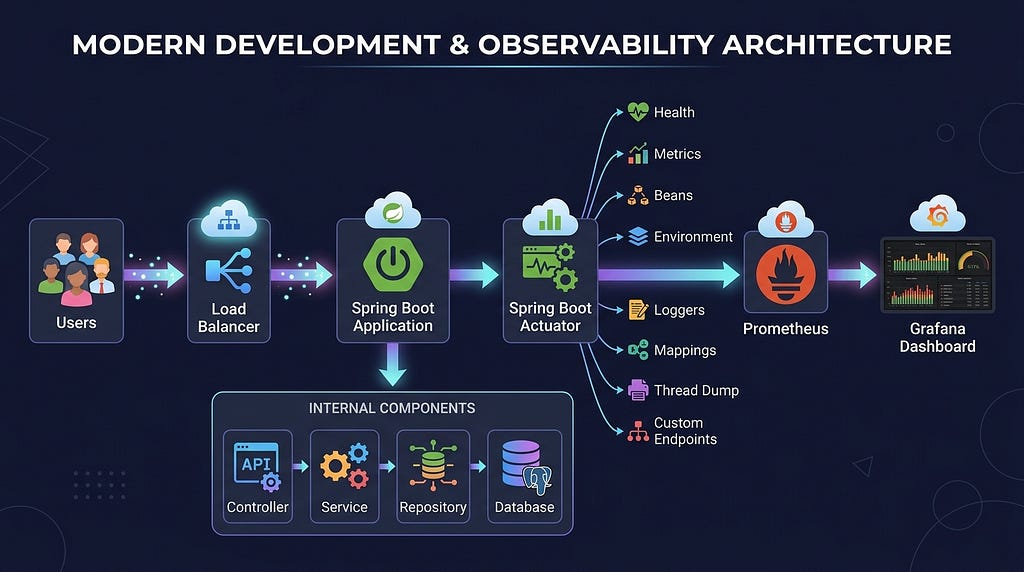
Prometheus + Grafana = Beautiful Dashboards
Numbers are useful.
Charts are better.
Imagine your doctor gives you this:
Heart Rate
81
82
79
80
83
81
Useful?
A little.
Now imagine this.
A graph showing your heart rate over the last 30 days.
Instantly understandable.
That’s what Grafana does.
Actuator provides the data.
Micrometer formats it.
Prometheus stores it.
Grafana visualizes it.
Companies don’t stare at JSON responses all day.
They look at dashboards.
One glance tells them
- Memory increasing?
- CPU overloaded?
- Request rate doubling?
- Error count rising?
- Database slowing down?
This is why almost every modern backend team uses monitoring dashboards.
🚨 The Biggest Mistake Beginners Make
I see this everywhere.
Someone discovers this property.
management.endpoints.web.exposure.include=*
They think,
“Awesome! Now I can access everything.”
Then…
They deploy it to production.
Please don’t.
Imagine leaving every room in your house unlocked.
Bedroom.
Office.
Garage.
Locker.
Basement.
Anyone can walk in.
That’s exactly what exposing every Actuator endpoint publicly does.
Some endpoints reveal:
- Environment variables
- Configuration
- Beans
- Thread Dumps
- Application mappings
- Internal details
An attacker doesn’t even need to exploit a vulnerability.
You’re literally handing them information.
Instead, expose only what you actually need.
For example:
management.endpoints.web.exposure.include=health,info,metrics
Much safer.
🔐 Protect Actuator with Spring Security
Production systems should never expose sensitive Actuator endpoints to everyone.
Here’s a simple example:
@Bean
public SecurityFilterChain securityFilterChain(HttpSecurity http) throws Exception {
    http
        .authorizeHttpRequests(auth -> auth
            .requestMatchers("/actuator/health").permitAll()
            .requestMatchers("/actuator/**").authenticated()
            .anyRequest().authenticated()
        )
        .httpBasic();
    return http.build();
}
Notice something interesting.
Everyone can check whether the application is alive.
But detailed operational information requires authentication.
That’s exactly how many production systems are configured.
One Small Trick I Wish Someone Told Me Earlier
When you’re learning Spring Boot, don’t memorize endpoint names.
Understand why they exist.
For example:
EndpointThink of it as…
/health :Doctor’s health report,
/metrics :Smart watch
/beans : Company employee directory
/mappings : Google Maps for APIs
/env : Application DNA
/loggers : Volume control
/threaddump : CCTV footage of every worker
/scheduledtasks : Office calendar
If you remember the analogy…
You’ll remember the endpoint forever.
That’s exactly how I finally stopped forgetting them.
A Quick Note
While writing this article, I realized how many small Spring Boot concepts we repeatedly Google.
Actuator endpoints.
Spring Security.
JPA annotations.
Docker commands.
REST best practices.
Validation annotations.
Interview questions.
I got tired of opening 15 browser tabs every day, so I compiled everything into a single reference that I personally use while building Spring Boot projects.
If you’re learning Spring Boot or preparing for interviews, you might find it useful too:
👉 Ultimate Spring Boot Interview & Development Cheat Sheet
https://pushpak48.gumroad.com/l/spring_cheat_sheet_v1
I still keep it open beside my IDE almost every day.
So… Is Spring Boot Actuator Really a Hidden Gem?
Absolutely.
It’s one of those tools you don’t appreciate…
Until the day something breaks in production.
Then suddenly…
It becomes the first thing you open.
You don’t become a better backend developer by writing more APIs.
You become a better backend developer when you can understand, monitor, and debug the APIs you’ve already built.
Spring Boot Actuator helps you do exactly that.
So the next time you create a Spring Boot project…
Don’t just add spring-boot-starter-web.
Add one more dependency.
It might be the dependency that saves your next production deployment.
If this article helped you understand Spring Boot Actuator, give it a ❤️ and share it with another developer who still thinks monitoring starts with checking application logs.
Happy Coding!

Spring Boot Actuator — The Hidden Gem Nobody Talks About was originally published in Javarevisited on Medium, where people are continuing the conversation by highlighting and responding to this story.
This post first appeared on Read More