A practical walkthrough of the runtime clues developers use to investigate slow, stuck, memory-heavy, or crashing Java applications.
When a Java application fails, the first thing we usually check is the application log. That is a good starting point. But logs do not always tell the full story.
An application may slow down without throwing an exception. Memory usage can keep growing, requests may get stuck, and in rare cases, the JVM may crash unexpectedly.
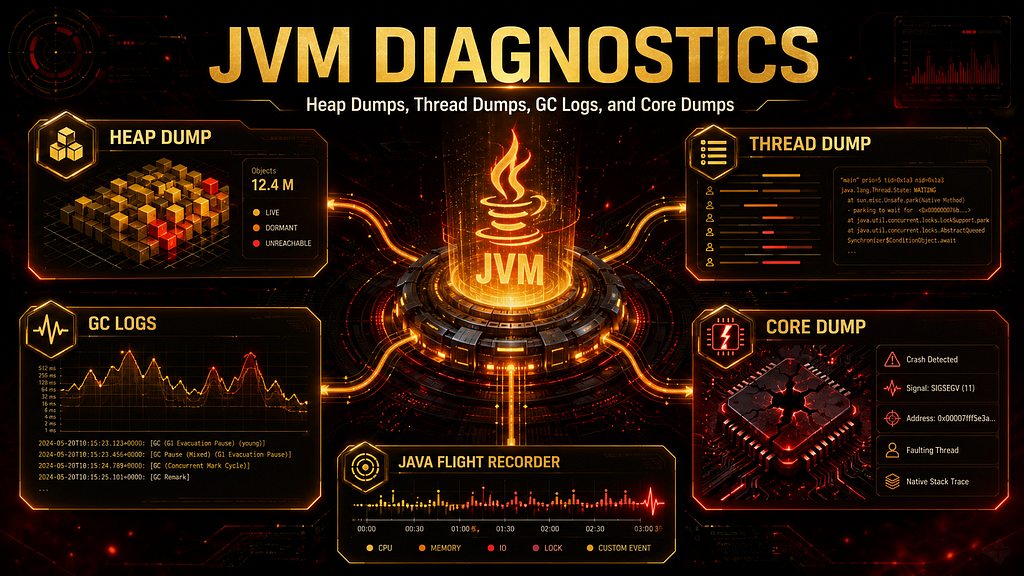
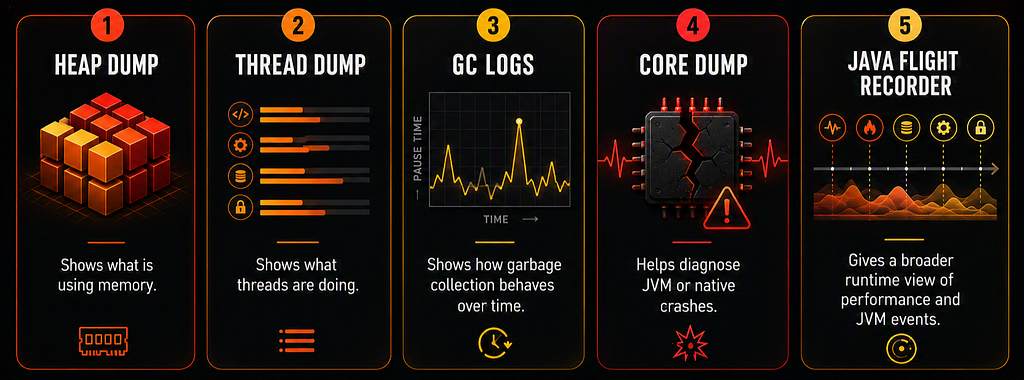
In these situations, diagnostic artifacts help us understand what was happening inside the JVM when the problem occurred. The most useful ones are:
Heap Dump
Thread Dump
GC Logs
Core Dump
Along with these, modern Java applications can also benefit from Java Flight Recorder, commonly called JFR.
Each artifact answers a different question.
Heap Dump  -> What is using memory?
Thread Dump -> What are the threads doing?
GC Logs -> How is Garbage Collection behaving?
Core Dump -> Why did the JVM crash?
JFR -> What happened over time inside the JVM?
1. Heap Dump: What Is Using Memory?
A heap dump is a snapshot of objects present in heap memory at a specific point in time. In simple words, it shows what objects exist in memory and how they are connected. A heap dump is useful when we investigate:
Memory leaks
OutOfMemoryError
Large object usage
Object retention paths
Unexpected heap growth
Java has Garbage Collection, but that does not mean memory leaks cannot happen. Garbage Collection removes objects that are no longer reachable. But if an object is still referenced, the JVM treats it as alive. That is where memory leaks can happen.
Here is a simplified example that demonstrates the idea of an unbounded cache. This is only for understanding the concept and should not be executed casually without proper memory limits.
import java.util.Map;
import java.util.UUID;
import java.util.concurrent.ConcurrentHashMap;

public class ReportCacheLeak {

    private static final Map<String, byte[]> reportCache = new ConcurrentHashMap<>();

    public static void main(String[] args) {
        while (true) {
            String reportId = UUID.randomUUID().toString();
            reportCache.put(reportId, new byte[1024 * 1024]);
        }
    }
}
In this example, every generated report is stored in a static cache using a unique ID. Since the cache keeps holding references to all report data and never removes old entries, the objects remain reachable. As a result, Garbage Collection cannot reclaim them, and memory usage keeps growing.
A heap dump can help us answer:
Which objects are taking most of the memory?
Which class has too many instances?
Who is holding references to those objects?
Why are unused objects not getting collected?
Common tools for heap dump analysis include:
Eclipse MAT
VisualVM
JProfiler
YourKit
One important point: heap dumps can be large and may contain sensitive data such as user information, tokens, or cached values. So in production, they should be collected and shared carefully.
2. Thread Dump: What Are the Threads Doing?
A thread dump is a snapshot of all active threads and their stack traces. If a heap dump helps us understand memory, a thread dump helps us understand execution. It is useful when we investigate:
Application hangs
Deadlocks
Blocked threads
High CPU usage
Slow requests
Thread contention
For example, if an application is not responding, it may not be a memory problem. It could be that request-handling threads are blocked, waiting for a lock, waiting for a database response, or stuck in a long-running operation.
A thread dump can show thread states such as:
RUNNABLE
BLOCKED
WAITING
TIMED_WAITING
This gives us a clear view of what the application was doing at that moment. Imagine a production service where users complain that the application is frozen. The logs may not show any clear exception.
In this case, a thread dump can reveal:
Many threads waiting for the same lock
A deadlock between two threads
Threads stuck in external API calls
Threads waiting for database connections
High CPU threads repeatedly executing the same code
Common tools for thread dump analysis include:
VisualVM
Java Mission Control
FastThread.io
Thread dumps are often easier and lighter to collect than heap dumps, so they are very useful during live production troubleshooting.
3. GC Logs: How Is Garbage Collection Behaving?
GC logs show Garbage Collection activity over time. A heap dump gives us a memory snapshot. GC logs give us a timeline. That is the main difference.
GC logs help us understand:
When GC happened
How long GC paused the application
How much memory was reclaimed
How often GC is running
Whether Young or Old Generation is under pressure
Why a GC event was triggered
GC logs are useful when we investigate:
Long GC pauses
High memory pressure
Frequent Full GC
High object allocation rate
Poor application throughput
Incorrect GC tuning
For example, if the application becomes slow every few seconds, GC logs may show frequent pauses. If the Old Generation keeps growing and Full GC happens repeatedly, it may indicate memory pressure or a possible memory leak.
A simple way to think about it:
Heap Dump -> What is in memory right now?
GC Logs -> How memory is changing over time?
Popular GC log analysis tools include:
GCeasy
IBM GC & Memory Visualizer
GarbageCat
One important point: GC log format can vary depending on the Java version, JVM vendor, garbage collector, and JVM logging options. So we should not expect every GC log to look exactly the same.
4. Core Dump: Why Did the JVM Crash?
A core dump is different from a heap dump and thread dump.
A core dump is a low-level snapshot of the process memory when the JVM crashes. It is usually generated by the operating system when a serious crash happens.
Core dumps are useful for issues such as:
JVM crash
Native memory problems
Segmentation faults
JNI-related issues
Native library failures
Most Java developers do not analyze core dumps every day. They are more common in deeper JVM, native code, or platform-level debugging.
For normal Java application issues, we usually start with heap dumps, thread dumps, and GC logs. But when the JVM itself crashes, a core dump can become important. In HotSpot JVM, a fatal crash may also produce a fatal error log file, commonly known as an hs_err_pid file. This file can contain details about the crash, the thread that failed, the problematic frame, loaded native libraries, JVM arguments, heap summary, and system information.
Tools used for deeper crash analysis include:
gdb
jhsdb
OS-level debuggers
A core dump is not the first tool we use for every problem. It is mainly useful when the JVM process terminates unexpectedly.
5. Java Flight Recorder: A Useful Additional Artifact
Apart from heap dumps, thread dumps, GC logs, and core dumps, one more useful diagnostic artifact is Java Flight Recorder, or JFR.
JFR records runtime events from the JVM and application with low overhead. It can help analyze:
CPU usage
Thread activity
Lock contention
Garbage Collection events
Object allocation
Method profiling
Application pauses
JFR is useful because it gives a time-based view of application behavior. Instead of only seeing one snapshot, we can see what happened over a period of time. For example, if an application slowly becomes slower under load, JFR can help us understand whether the issue is related to CPU, allocation rate, locks, GC, or method execution. JFR is especially helpful when the problem is not clearly memory-only or thread-only.
A simple way to understand it:
Heap Dump -> Memory snapshot
Thread Dump -> Thread snapshot
GC Logs -> GC timeline
JFR -> Runtime event timeline
Core Dump -> Crash-level snapshot
Which Artifact Should We Use First?
Choosing the right artifact depends on the symptom.
Memory keeps increasing -> Heap Dump + GC Logs
Application is hanging -> Thread Dump
Long GC pauses -> GC Logs
JVM crashed -> Fatal Error Log + Core Dump
Unclear performance issue -> JFR + Profiling
This approach avoids collecting random files without knowing what we are looking for.
A Simple Troubleshooting Flow
When a production issue happens, we can follow a simple flow:
1. Understand the symptom
2. Check application logs and metrics
3. Decide whether it is memory, thread, GC, performance, or crash related
4. Collect the correct diagnostic artifact
5. Analyze it using the right tool
6. Identify the root cause
7. Apply the fix
8. Monitor again
For example, for high memory usage:
Check memory metrics
Review GC logs
Capture heap dump
Analyze retained objects
Find what is holding references
Fix the leak or configuration
Monitor again
For an application hang:
Check request latency
Capture thread dumps
Look for BLOCKED or WAITING threads
Identify lock or external dependency issues
Fix the blocking point
This makes troubleshooting more structured and less based on assumptions.
Final Takeaway
Each JVM diagnostic artifact answers a different production question.
As Java developers, we do not need to master every diagnostic tool on day one. What matters is knowing which signal to collect when an issue appears. That is how we move from guessing to investigating, and in production troubleshooting, that difference matters.
![]()
Beyond Application Logs: How JVM Diagnostics Reveal What Really Happened was originally published in Javarevisited on Medium, where people are continuing the conversation by highlighting and responding to this story.
This post first appeared on Read More