
The JVM has always been powerful. For 30 years, its one unforgivable sin was making you wait. That’s changing, and the approach is smarter than anything the industry expected.

This is Article 3 in the Java Series. Article 1 covers the full state of Java in 2026. Article 2 explains how Virtual Threads made reactive programming optional.
In 2018, a Java architect at a major financial firm gave a conference talk. The title was blunt: “Why We’re Losing the Cloud-Native War.”
His argument wasn’t about language features. It wasn’t about ecosystem or libraries. It was about one number: startup time.
Their Spring Boot services took 8 to 12 seconds to start cold. A Go microservice doing the same job started in 80 milliseconds. In a Kubernetes environment doing rolling deploys, horizontal autoscaling, and chaos engineering, those 8–12 seconds weren’t just slow, they were expensive. Cold starts in Lambda functions were nearly unusable. Autoscaling under burst load was sluggish. Every deployment meant a multi-second window where pods were starting but not serving.
The JVM, the most battle-tested, deeply optimized virtual machine in the history of computing, had a startup problem.
The industry’s initial answer was GraalVM Native Image: abandon the JVM at runtime, compile ahead of time, ship a native binary. Start in milliseconds.
It worked. It also introduced an entirely new set of problems that teams are still fighting with today.
Project Leyden is a different answer. Not “abandon the JVM.” Instead: teach the JVM to remember what it already did.
This article is a deep dive into how Leyden works, what it has delivered across JDK 24, 25, and 26, and how it compares to the GraalVM approach in real production scenarios.
First: Why the JVM Starts Slowly
To understand what Leyden fixes, you have to understand exactly where the JVM spends time during startup.
When you run java -jar myapp.jar, the JVM performs a sequence of expensive, redundant operations on every single launch:
Phase 1: Class Loading
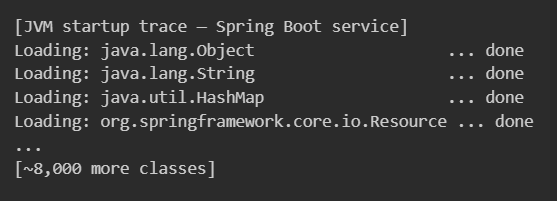
The JVM reads .class files from disk (or jar entries), parses their bytecode format, validates their structure, and loads them into memory. A typical Spring Boot application loads 5,000 to 15,000 classes during startup. Each class load involves disk I/O, bytecode parsing, and memory allocation.
Phase 2: Class Linking
After loading, the JVM links classes: it verifies bytecode semantics, resolves symbolic references between classes, and prepares static fields. This is more CPU work applied to the same classes, again and again, on every boot.
Phase 3: JIT Warmup
The JVM starts executing bytecode immediately after linking. But it starts in interpreted mode, significantly slower than native code. The HotSpot JIT compiler identifies “hot” methods (methods called frequently) and compiles them to optimized native code at runtime.
This warmup process takes time. Depending on the application, it can take 30 seconds to several minutes before the JVM is executing at peak throughput.
For long-running services, warmup is a one-time cost. For short-lived serverless functions, pods that scale in under load, or jobs that restart frequently, warmup is paid every single time.
The cruel irony of traditional JVMs: they’re extraordinarily fast at steady state, but you have to run through a slow-motion setup process to get there, every time you restart.
The Class Data Sharing Precedent
Project Leyden didn’t invent the idea of caching JVM work. That idea started with Class Data Sharing (CDS), introduced in Java 1.5 and significantly improved through Java 13+.
CDS works like this: instead of loading the JDK’s own core classes from scratch on every startup, the JVM can be told to create a shared archive (a .jsa file) containing pre-parsed, pre-linked versions of the JDK core classes. On subsequent runs, those classes are loaded directly from the archive via memory-mapped I/O, no re-parsing, no re-linking.
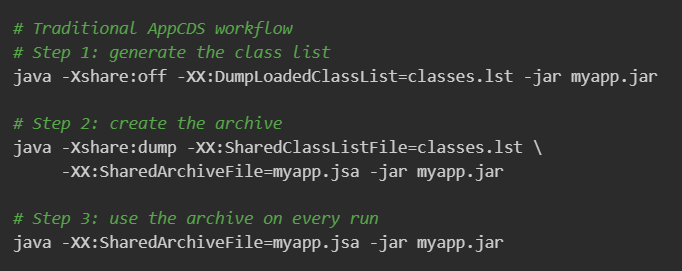
AppCDS works. Production benchmarks consistently show 20–30% startup improvement just from caching the JDK classes plus the application’s own class metadata.
But CDS only addresses Phase 1 (class loading) and Phase 2 (class linking) partially. It doesn’t touch JIT warmup. And the workflow, dump list, create archive, run with archive, is tedious, error-prone, and breaks if your application changes.
Project Leyden takes CDS and extends it in three progressive directions:
- AOT Class Loading & Linking: A better CDS. More complete, more automatic. (JDK 24, JEP 483)
- AOT Method Profiling: Cache the JIT compiler’s decision-making history. (JDK 25, JEP 515)
- AOT Object Caching: Cache actual heap objects from the initialization phase. (JDK 26, JEP 516)
Each JEP builds on the previous. Together, they represent a complete rethinking of when JVM work happens.
The Architecture: Training Runs and Condensers
Before covering each JEP, the architectural concept that underlies all of Leyden: training runs and condensers.
The Training Run
A training run is a deliberate, representative execution of your application whose purpose is observation, not production serving.
You run your application exactly as it would run in production, same configuration, same dependencies, same startup sequence, same warm-up traffic. But during this run, the JVM watches and records:
- Which classes were loaded and in what order
- How those classes were linked and resolved
- Which methods were called frequently enough to trigger JIT compilation
- What the JIT’s optimization decisions looked like after warmup
- What heap objects were allocated during initialization
This recorded state is written to an AOT cache, a persistent file that captures everything the JVM learned.
On every subsequent production start, the JVM reads the AOT cache and restores that state, skipping the work it already did during training.

Condensers
The Leyden team uses the term condenser to describe the pipeline step that transforms a running program’s observed state into a compressed, persistent form. The condenser concept is deliberately extensible, today it captures class data, method profiles, and heap objects. In future JDK versions, it may capture more.
The key insight: a condenser shifts work left. Work that used to happen at runtime, on every startup, now happens once at build/training time, and the result is reused forever after.
This is the same conceptual move that compilers made decades ago, shift work from runtime to compile time. Leyden applies that idea to the JVM’s own initialization pipeline.
JEP 483: AOT Class Loading & Linking (JDK 24)
JEP 483, delivered in JDK 24, is the first major Leyden feature in production. It extends AppCDS from a workflow-heavy, partial solution into a streamlined, comprehensive one.
What It Captures
Where AppCDS cached class metadata (parsed bytecode structure), JEP 483 captures the full class loading and linking state:
- Class identity: the exact bytecode of each loaded class
- Linking state: resolved symbolic references, static field preparation
- Loader constraints: which classloader loaded which class
- Verification results: bytecode verification has already been done; don’t repeat it
The New Workflow
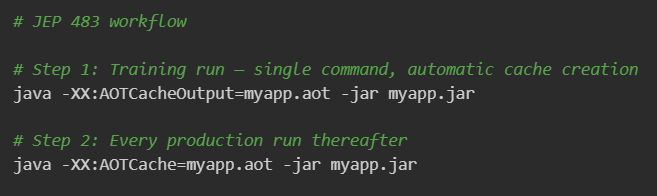
Two flags. The training run creates the cache. Every production run loads it.
Compare this to the old AppCDS workflow: three steps, two intermediate files, manual class list management. JEP 483 collapses the friction.
What You Get
In JDK 24 benchmarks on a typical Spring Boot application:
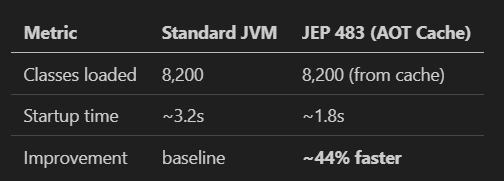
Class loading time is largely eliminated. Linking time is largely eliminated. The JVM wakes up with its class hierarchy already in place.
JEP 515: AOT Method Profiling (JDK 25)
JEP 483 addressed startup time, the time from java -jar to “application is initialized.” But it didn’t address warmup time, the time from “initialized” to “running at peak throughput.”
The JIT compiler’s job is to find hot methods and compile them to optimized native code. This takes time because the JIT has to observe which methods are actually hot, then compile them.
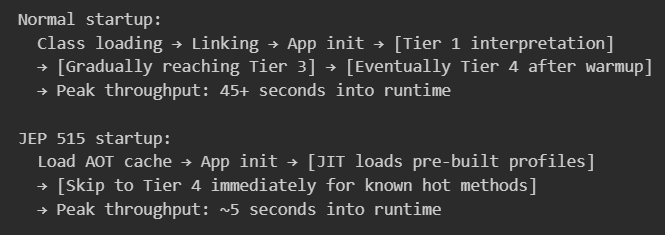
JEP 515, in JDK 25, caches the JIT compiler’s profile from the training run.
How JIT Profiling Works
The HotSpot JIT compiles methods in tiers:
- Tier 1 (Interpreted): Bytecode runs in the interpreter. Slow, but the JVM collects profiling data.
- Tier 3 (C1 compiled): The method has been called enough that the JVM compiles it to lightly-optimized native code. Still collects profiles.
- Tier 4 (C2 compiled): The method is hot. The JVM uses the collected profiles to apply aggressive optimizations, inlining, loop unrolling, speculative deoptimization, escape analysis.
The profiles that drive Tier 4 compilation take time to build. On a cold JVM, it can take 30+ seconds of live traffic before critical code paths hit Tier 4.
What JEP 515 Does
The training run, in addition to recording class loading state, now also records the method execution profiles that the JIT accumulated.
On a subsequent production start:
The Code Impact
From your application’s perspective, nothing changes. No annotations, no build plugins, no code modifications. The JVM handles this transparently.

The AOT cache now contains two things: class loading state and JIT method profiles. One file, one flag.
Measured Impact
The combination of JEP 483 + JEP 515 shows:
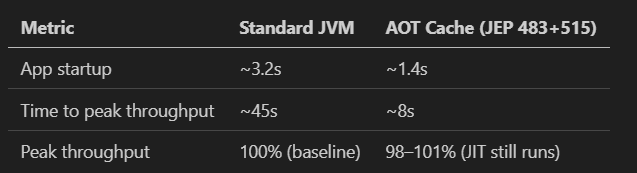
The JIT still runs in production. Profiles are a starting point, not a ceiling. If production traffic differs from training traffic, the JIT adapts. This is the fundamental difference from static AOT compilation: Leyden’s optimization is adaptive, not frozen.
JEP 514: AOT Command-Line Ergonomics (JDK 25)
JEP 514, also in JDK 25, is a quality-of-life improvement that makes the Leyden workflow practical for CI/CD environments.
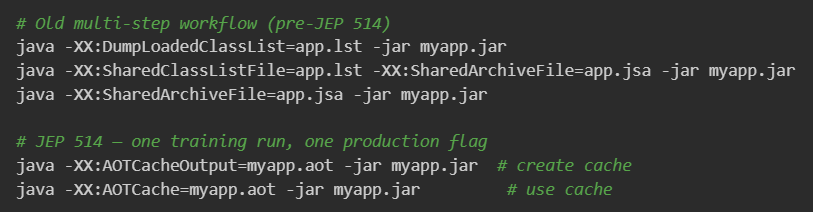
Before JEP 514, creating the AOT cache required a multi-step workflow: run in record mode, then run in create mode, then run in production mode. Each step had different flags.
JEP 514 introduces one-shot cache creation with the -XX:AOTCacheOutput flag, which automatically handles both the recording and serialization phases in a single run:
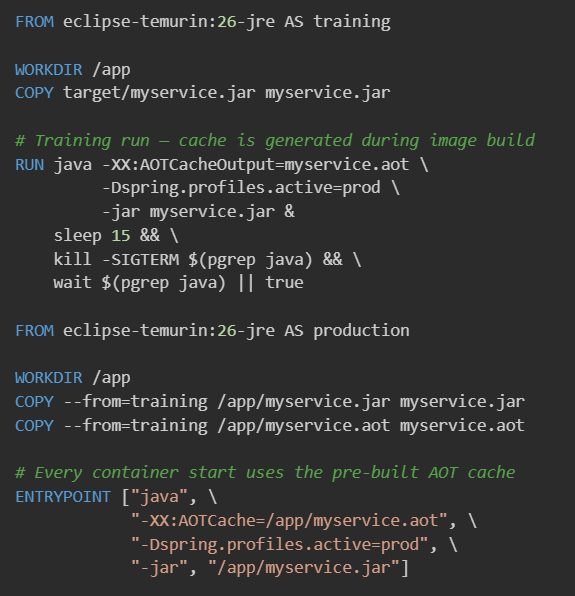
For CI/CD pipelines, this translates directly to simpler Dockerfiles:
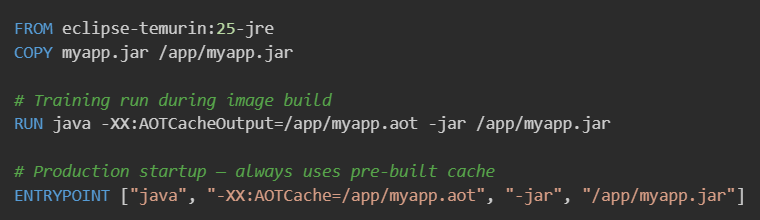
The AOT cache is built once, baked into the image, and used on every container start. Zero per-startup overhead for class loading or JIT warmup.
JEP 516: AOT Object Caching with Any GC (JDK 26)
JEP 516 is the most architecturally ambitious Leyden feature delivered so far, and the one that directly unlocks Spring Boot’s most expensive startup cost.
The Problem: Heap Initialization
After class loading and JIT warmup, a Spring Boot application’s remaining startup cost is object initialization: the Spring ApplicationContext is building. It’s:
- Scanning classpath for @Component, @Service, @Repository annotations
- Creating and wiring beans
- Instantiating connection pools
- Building serialization/deserialization metadata (Jackson, for example)
- Loading reference data from databases or config files
This work produces heap objects, potentially thousands of them. And these objects are identical on every startup. The Spring ApplicationContext for a given application produces the same bean graph every single time.
Why does the JVM rebuild this from scratch every restart?
What JEP 516 Does
JEP 516 allows the AOT cache to include heap objects, actual live Java objects, serialized into the cache during the training run and materialized back into the heap at startup.
During the training run, after the application has fully initialized, the JVM can freeze a snapshot of specified heap regions and write them into the AOT cache. On subsequent starts, those objects are streamed back into the heap without re-executing the initialization code.
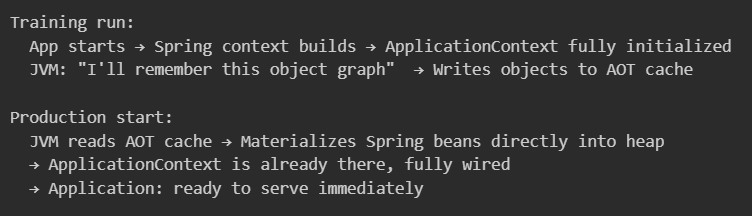
The GC-Agnostic Streaming Format
The technical challenge JEP 516 solved is non-trivial. Previous attempts at heap object caching failed with Generational ZGC (the preferred collector in 2026) because ZGC uses colored pointers, object references include metadata bits in the pointer address itself. ZGC’s object layout is fundamentally incompatible with a naively memory-mapped object snapshot.
JEP 516’s solution: instead of memory-mapping cached objects (which requires a GC-specific layout), it uses a GC-agnostic streaming format. Objects are serialized as a structured byte stream during the training run. At startup, they are deserialized and materialized according to the GC currently in use, ZGC gets ZGC-format objects, G1 gets G1-format objects.
This makes the AOT cache portable across all supported GC configurations. One cache file works whether you’re using G1, ZGC, or Generational ZGC.
Combined Impact: All Three JEPs Together
With JEP 483 + 515 + 516, a benchmarked Spring Boot application shows:
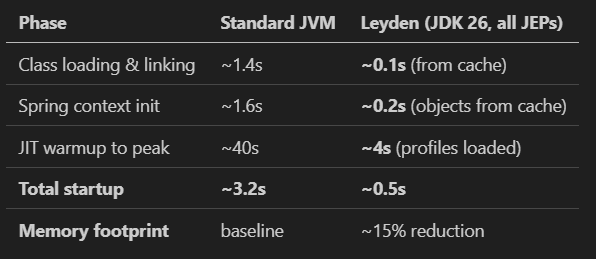
That’s roughly a 6x startup improvement on a real Spring Boot service, without changing a single line of application code, without GraalVM, without native image compilation.
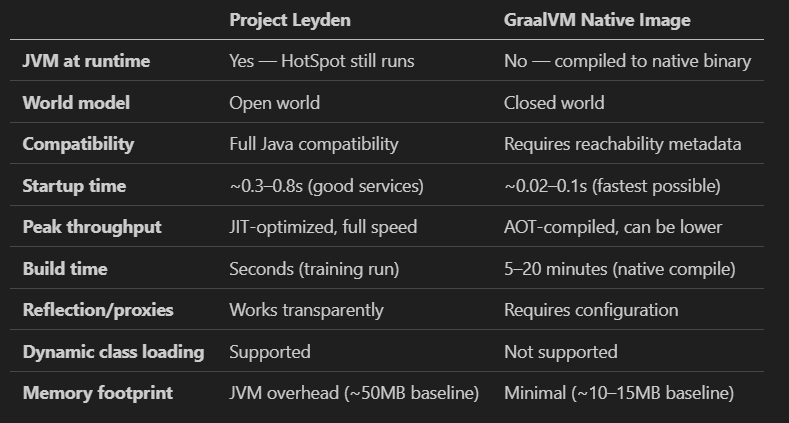
Leyden vs. GraalVM Native Image: A Serious Comparison
This is the comparison that gets oversimplified everywhere. Let’s be precise.
The Philosophical Difference
When GraalVM Native Image Still Wins
AWS Lambda and cold-start-sensitive FaaS: If you’re paying for every millisecond of cold start latency, and Lambda’s billing model means you are, GraalVM’s sub-100ms startup is worth the configuration investment. Leyden’s 300–500ms is still dramatically better than the JVM baseline, but Native Image remains king at the absolute latency floor.
Extremely memory-constrained environments: Embedded systems or edge nodes where the JVM’s base memory overhead (~50–100MB) is unacceptable. Native Image binaries start at 10–15MB.
Applications with completely static behavior: If your application has no runtime reflection, no dynamic class loading, and no runtime proxies, a simple CLI utility, for example, Native Image is straightforward to configure and delivers maximum performance.
When Leyden Is the Better Answer
Complex enterprise frameworks: Spring Boot, Hibernate, Jackson, all rely heavily on reflection, dynamic proxies, and runtime class generation. Getting these to work under GraalVM’s closed-world constraints requires extensive reachability metadata configuration. Each new library you add potentially breaks native compilation. Leyden handles all of this transparently.
Teams that can’t afford native image maintenance: GraalVM native image compilation is a build-time engineering discipline. You need someone who understands reachability analysis, can diagnose subtle native image failures, and can manage the metadata configuration as dependencies evolve. Not every team has this capacity.
Peak throughput matters: If your service runs long (containers with multi-hour lifetimes, not ephemeral serverless functions), the JIT compiler’s adaptive optimization pays dividends that static AOT compilation cannot match. A JIT-optimized method can outperform its AOT equivalent by 20–40% on data-structure-heavy workloads.
Development velocity: Leyden requires zero application code changes. GraalVM requires ongoing testing of native compilation success. For teams shipping features rapidly, the difference in friction is significant.
Applying Leyden in Practice: A Spring Boot 4 Walkthrough
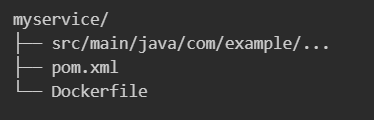
Here’s a practical, production-ready Leyden integration for a Spring Boot 4 service.
Project Structure
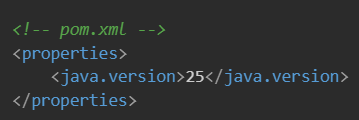
Step 1: Ensure You’re on JDK 25 or 26
Step 2: Build the Jar Normally

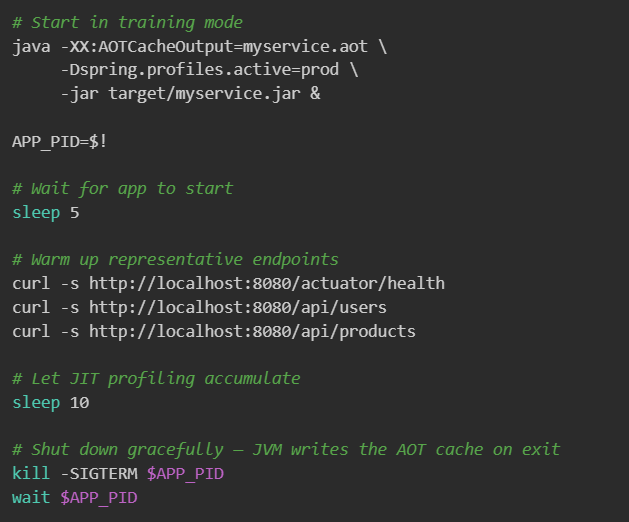
Step 3: Create the Training Run
The training run should exercise your application’s actual startup sequence. If your app needs to warm up HTTP endpoints, call them during the training run:
Step 4: Dockerfile with AOT Cache
Step 5: Verify the Cache Is Being Used
The JVM provides logging to confirm the AOT cache is active:
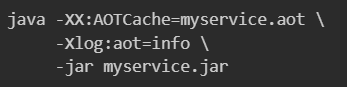
Look for output like:

What to Watch Out For
Training representativeness is critical. If your training run doesn’t exercise a code path that gets called heavily in production, that path won’t have JIT profiles in the cache and will warm up cold. For maximum benefit, your training run’s traffic should be as close to production traffic as possible.
The cache is invalidated when your jar changes. If you deploy a new version, you need a new training run and a new cache. This is expected behavior, bake cache generation into your CI/CD pipeline.
Class loading from new sources breaks the cache. If your application dynamically loads classes at runtime (plugin systems, hot-reload frameworks), those classes won’t be in the cache. Leyden handles this gracefully, it falls back to normal class loading, but you won’t get caching benefits for those paths.
The Bigger Picture: What Leyden Means for Java’s Future
Project Leyden is not just a startup optimization. It represents a maturing of the “shift left” principle applied to the JVM.
For 30 years, the JVM’s value proposition was: “We’ll optimize aggressively at runtime, using information we only know after the program starts running.” The JIT is the embodiment of this philosophy, it waits to see what code is actually hot before spending cycles compiling it.
Leyden doesn’t abandon that philosophy. It augments it: “We’ll also remember what we learned from previous runs, so we don’t have to re-learn it every time.”
The condenser model is extensible. Today it captures class data, JIT profiles, and heap objects. In future JDK releases, it may capture:
- Reflection resolution results (the table of “this class has these methods”)
- Dynamic proxy class structures (Spring’s AOP proxies are generated once, cached forever)
- Database connection pool initialization state
- Configuration parsing results
Each extension pushes startup further toward the theoretical limit: a JVM that starts exactly where it left off.
This is the vision the Leyden team described in their original proposal: a JVM that is not just fast at steady state, but fast from the first instruction of every run.
What This Means for Your Architecture Decisions Right Now
If you’re building a new Java service in 2026: Design your Dockerfile to include a training run from the start. It’s a 15-minute investment that pays dividends on every deployment.
If you’re running Java services on Kubernetes: Leyden’s startup improvement directly reduces the window during rolling deployments where pods are starting but not serving. Tighter startup = smoother deploys = less need for overly conservative startupProbe timeouts.
If you’ve been using GraalVM Native Image: Re-evaluate. If you’re spending significant engineering time managing reachability metadata and native image build failures, Leyden now provides 80% of the startup benefit with 5% of the operational complexity.
If your team dismissed Java for Go or Python for startup reasons: The argument has expired. A Leyden-optimized Spring Boot service starts in 300–500ms. That’s Go territory, with the full Java ecosystem behind it.
The State of the War
The startup war was never just about milliseconds. It was about whether Java, with all its ecosystem maturity, its enterprise reliability, its extraordinary runtime performance, could be a first-class citizen in modern cloud-native infrastructure.
For years, the honest answer was: not quite.
GraalVM offered an exit, but it was a costly one, trading ecosystem compatibility for startup speed, maintenance simplicity for performance extremes.
Leyden offers something better: you don’t have to choose. Keep the JVM. Keep the full ecosystem. Keep the JIT’s adaptive optimization. Just tell the JVM to remember what it already knows.
It took 30 years for the Java platform to arrive at this answer. The answer was worth waiting for.
Next in the Java Series: Project Valhalla Deep Dive: Value Classes and Why Every Java Collection Will Change.
Beyond the Code: The Realities of Engineering
Understanding Project Leyden tells you how the JVM is evolving. But knowing when to advocate for a Java upgrade at your company, how to make the performance case to a risk-averse team, and how to position yourself as the engineer who leads platform decisions, that’s a different skill set entirely.
I’ve distilled the unwritten rules of navigating software engineering careers into a practical field guide.
👉 Get “Beyond the Offer Letter” on Gumroad here: and learn how software companies actually work so you can accelerate your growth.

Project Leyden Deep Dive: How the JVM Is Finally Winning the Startup War was originally published in Javarevisited on Medium, where people are continuing the conversation by highlighting and responding to this story.
This post first appeared on Read More