

Let me be brutally honest with you.
When I first deployed Temporal in production, I thought I was done. Workflows were running. Activities were executing. Everything looked fine.
Then traffic spiked.
Schedule-to-start latency shot up. Workers were sitting idle. Backlogs kept growing.
And I had no idea why.
I spent days staring at dashboards, reading GitHub issues, asking in the Temporal Slack. Slowly, painfully, I figured it out.
Before I understood how to fix it, I had to understand what I was actually scaling.
A Temporal deployment has four internal services — Frontend, History, Matching, and Worker. Behind them, two stores do the heavy lifting. Persistence Store for durable state. Visibility Store for search.
Every single scaling problem I ever hit traced back to one of these six things.
So I split my scaling mental model into two worlds.
One is the world you control directly: your workers, your queries, your database choices. The other is the world the server owns: shards, cluster topology, replication.
Both need attention. Most people only fix one.
Part 1: Client-Side and Database-Side Scaling
This is the part you own. Workers, task queues, namespaces, and the databases behind your workflows.
My Workers Were the Problem. Just Not in the Way I Thought.
When things slowed down, my first instinct was: add more worker pods. It helped a little. But not enough.
Then I actually looked at the SDK defaults.
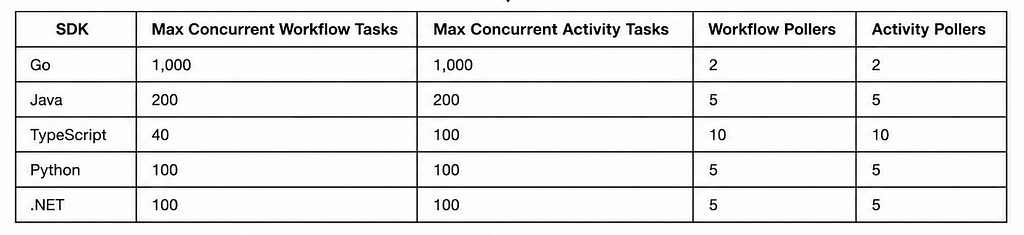
Five pollers. Five.
Here’s what happens with only five pollers: Your worker has 200 execution slots sitting ready. But only 5 threads are fetching tasks from the server. So 195 slots just… wait.
The docs say poller count should be “significantly ≤” executor slots. But that doesn’t mean keep them at 5. It means pollers should never be your bottleneck.
I bumped Java pollers from 5 to 20. Latency dropped immediately.
WorkerOptions workerOptions = WorkerOptions.newBuilder()
    .setMaxConcurrentWorkflowTaskExecutionSize(200)
    .setMaxConcurrentActivityExecutionSize(200)
    .setMaxConcurrentWorkflowTaskPollers(20)
    .setMaxConcurrentActivityTaskPollers(20)
    .build();
If you’re on Temporal Server v1.28+, there’s an even better option. PollerBehaviorAutoscaling — pollers adjust automatically based on queue depth. The docs say it “results in more efficient poller usage, better throughput, and schedule-to-start latency improvements.”
Enable it. Stop guessing at poller counts.
I Also Had a Cache Problem I Didn’t Know About
Workflows in Temporal are deterministic. When a worker picks up a workflow task, it replays the entire event history to reconstruct state.
Unless it’s cached.
The sticky workflow cache keeps workflow state in memory. Cache hit = instant resume. Cache miss = full replay from history. Expensive. Slow.
Java SDK default cache size: 600 workflows per host. Go and .NET default: 10,000.
Six hundred.
If you’re running Java with more than 600 concurrent long-running workflows per host, you’re replaying constantly. I was.
The fix: check your RAM headroom, then raise workflowCacheSize.
These are the six metrics I now watch permanently:
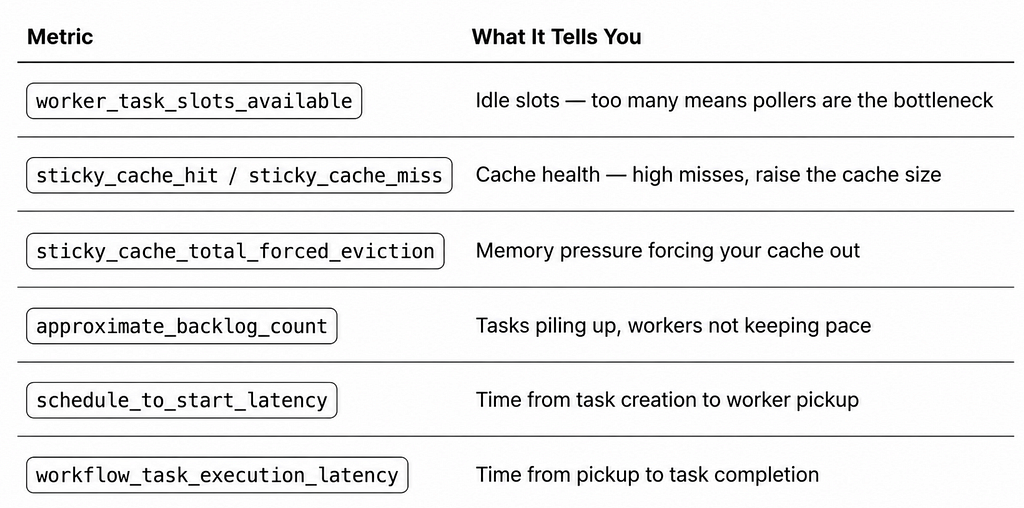
These six metrics told me more than three days of log reading ever did.
I Was Designing Task Queues Wrong
I had one task queue for everything. Order processing. Notifications. Report generation. All on one queue.
When report generation got busy, order processing slowed down. Users complained. I panicked.
Task queues are not just routing labels. They are your isolation and prioritization boundary.
What I do now:
One queue per capability type. Heavy CPU jobs separate from lightweight IO jobs. Separate queues for SLA-critical versus best-effort work. Never dynamically name queues. Every unique name needs its own polling connections. I once had 300+ queues by accident. Connection chaos.
Use maxTaskQueueActivitiesPerSecond to protect downstream systems. Your database doesn’t care that Temporal can push 10,000 activity tasks per second.
Simple rule I follow now: If two types of work have different SLAs or different resource profiles, they get different queues.
Namespaces Are Not Just for Organization
I started with one namespace for everything. default.
Then a batch job in the same namespace caused scheduling delays for our real-time user-facing workflows. Both were in default. Both competed for the same Matching service.
Temporal says it directly:
“Heavy traffic from one Namespace will not impact other Namespaces running on the same Temporal Service.”
Namespaces are your soft isolation layer. Here’s how I think about them now:
- prod-payments — SLA-critical, low latency
- prod-notifications — best-effort, high volume
- prod-reports — batch jobs, can be slow
- staging, dev — always separated from prod
One caveat: namespaces share the underlying cluster. For hard resource isolation — separate clusters.
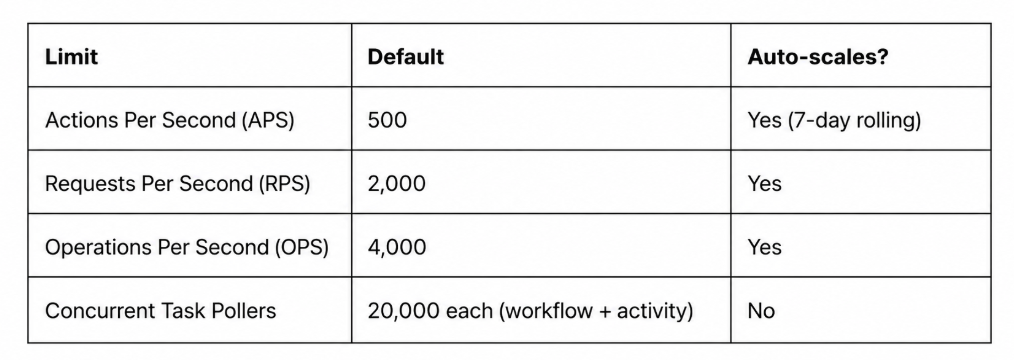
On Temporal Cloud, each namespace auto-scales but has limits worth knowing:
I Set Up Elasticsearch. It Changed Everything.
Before Elasticsearch: I could list workflows by status. That was it. After: I could filter by customer ID, order type, date range, error message, any custom field I wanted.
This is Advanced Visibility. It’s non-negotiable at production scale.
Standard Visibility was deprecated in Temporal Server v1.24. If you’re still on it, you’re on borrowed time.
“Use Elasticsearch or OpenSearch for large-scale operations — especially any setup that spawns more than a few Workflow Executions.”
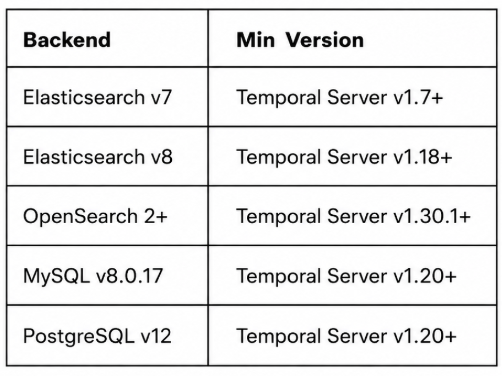
Supported backends
Config:
persistence:
  visibilityStore: es-visibility
  datastores:
    es-visibility:
      elasticsearch:
        version: "v8"
        url:
          scheme: "https"
          host: "your-es-host:9200"
        indices:
          visibility: temporal_visibility_v1_prod
Then run temporal-elasticsearch-tool create-all-indices to initialize.
Keep your visibility Elasticsearch cluster separate from your application’s. When visibility queries spike, you don’t want them fighting your app’s search traffic.
The Persistence Store Is Your Throughput Floor
Your persistence backend sets the ceiling on how fast Temporal can write workflow events.
BackendBest ForNotesApache CassandraMassive scale, multi-regionBest horizontal scalability, highest operational complexityPostgreSQLMost production deploymentsSolid choice, supports multi-schema setupsMySQLTeams already running MySQLGood for moderate scale
For Cassandra: use local SSD-backed nodes. Rotational storage becomes the bottleneck fast. Set replication factor to 3 minimum across availability zones.
For PostgreSQL: add PgBouncer for connection pooling. Temporal opens many connections per service instance at scale — without pooling, you’ll hit PostgreSQL’s connection limit before you hit your workflow limit.
Part 2: Server-Side Scaling
This is the part the Temporal Server owns. Shards, cluster architecture, replication, and observability.
The Mistake That Almost Cost Me Everything
Shard count.
I didn’t think about it. I used the default. Big mistake.
Here’s the thing about history shards nobody tells you upfront.
The Temporal docs say it clearly:
“Shard capacity, and often overall cluster throughput, is set at build time.”
Set at build time. That means you cannot change it later without a full data migration.
Shards are how the History service distributes workflow executions across your database. More shards = more throughput ceiling. But once you deploy, that number is locked in forever.
For moderate workloads: 512 shards. For millions of executions per day: 2048 or 4096.
persistence:
  numHistoryShards: 512
Pick this number before you write a single line of production config. It is the one decision you cannot undo.
I Hit the Event History Limit in Production
51,200 events. 50 MB. That’s the hard maximum for a single workflow execution’s history.
I hit it.
We had a long-running order orchestration workflow. Every retry, every signal, every activity result — all events. After months of running — boom. History limit. Workflow stuck.
The fix is Continue-as-New. When your workflow approaches the limit, call Continue-as-New. It starts a fresh execution with clean history while preserving your logical continuation.
Other limits I wish I had planned around from day one:
LimitValueMax incomplete Activities per Workflow2,000 (optimal: 500)Max Signals per Workflow Execution10,000Max Event History51,200 events or 50 MBMax payload per request2 MBMax gRPC message size4 MBMax in-flight Updates10Max Workflow ID or Task Queue name length1,000 bytes
One more trap on Temporal Cloud: APS, RPS, and OPS auto-scale based on the last 7 days of usage. It looks backward, not forward. If you know a spike is coming — a launch, a sale, a batch run — contact support to pre-provision. Don’t wait for auto-scaling to figure it out.
I Added Multi-Cluster Replication. Then I Could Sleep at Night.
A single Temporal cluster is a single point of failure. I didn’t think about this until I had to present a disaster recovery plan to leadership.
I had none.
Multi-Cluster Replication is Temporal’s answer. One active cluster processes everything. One or more passive clusters receive replicated state asynchronously.
From the official docs:
“Asynchronously replicates Workflow Executions from active Clusters to other passive Clusters, for backup and state reconstruction.”
Key word: asynchronously. Passive clusters are eventually consistent. Not strongly consistent. You accept that trade-off for availability.
Setup:
clusterMetadata:
  enableGlobalNamespace: true
  failoverVersionIncrement: 10   # Must be identical across all clusters
  initialFailoverVersion: 1      # Must be unique per cluster
Connect clusters:
temporal operator cluster upsert --frontend-address <remote-cluster-addr>
Trigger failover:
temporal operator namespace update --promote-global <namespace>
If you’re on Temporal Cloud — multi-region HA is built in. Zero config. That alone is worth the cost for many teams.
I Built Dashboards Before I Needed Them
The worst time to build observability is during an incident. I did that once. Never again.
Temporal exposes Prometheus metrics out of the box. Three categories the official production checklist calls mandatory:
Service health:
service_requests{operation="..."}
service_errors{operation="..."}
service_latency{operation="..."}
Database health:
persistence_requests{operation="..."}
persistence_errors{operation="..."}
persistence_latency{operation="..."}
Workflow execution health (per namespace):
workflow_success_count{namespace="..."}
workflow_failed_count{namespace="..."}
workflow_timeout_count{namespace="..."}
workflow_terminate_count{namespace="..."}
Four dashboards I keep open at all times:
Backlog — approximate_backlog_count per task queue. Alert the moment it grows unbounded. Worker slots — worker_task_slots_available. Alert if slots are pinned at zero. Cache hit rate — sticky_cache_hit vs sticky_cache_miss. Alert on sudden miss spikes. Latency — schedule_to_start_latency and start_to_close_latency. Alert on SLA breach.
Build these before you launch. Not after your first incident.
My Honest Advice if You’re Scaling Temporal
If you’re just starting — or if you’ve already hit production pain — here’s what I’d tell myself two years ago.
Temporal is not hard to start. But it is dangerously easy to misconfigure for scale.
On the client and database side: Raise your pollers. Increase your cache. Isolate task queues by SLA. Set up Elasticsearch from day one.
On the server side: Lock in your shard count before deployment. Plan your Continue-as-New strategy before you hit 51,000 events. Set up multi-cluster replication before you need it.
You don’t need to get everything perfect on day one. But you do need to know what is permanent and what can be tuned later.
Shards are permanent. Everything else has a dial.
Final Thought: Temporal Rewards Those Who Understand It
The teams running Temporal at Netflix, DoorDash, and Coinbase scale are not smarter than you. They just understood the architecture deeply and made deliberate decisions early.
You can too.
Split your thinking into two worlds. Fix what your workers, queues, and databases are doing. Then fix what your server, shards, and clusters are doing.
Do both — and Temporal will be the most reliable piece of infrastructure you’ve ever shipped.
If you made it till here, thank you ❤️ I’m sharing more such learnings from real backend on my journey.

Temporal Burned Me in Production. Here’s Everything I Learned About Scaling It Right was originally published in Javarevisited on Medium, where people are continuing the conversation by highlighting and responding to this story.
This post first appeared on Read More